 By Tia Will
There is a great deal of disagreement about which of the two candidates for DA will provide the greater degree of safety for our communities. One thing I believe we can agree upon is that, to the extent possible, substantiating one’s claims with evidence makes for a stronger, more objective argument than assertion alone.
It has been suggested in a number of comments on the Vanguard that the crime rate under current DA Jeff Reisig has been steadily dropping, with some exceptions over the past ten years.
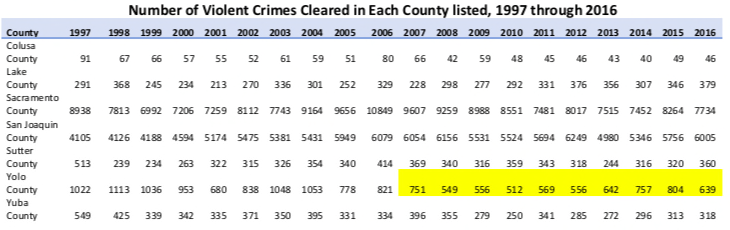
In the interest of assessing this claim, we (RDC and myself) looked up statistics for the past 10 years for Yolo and six nearby counties. Being aware that county numbers of crimes will vary widely depending on the composition of the county, we chose to look at crime clearance rates, number of violent crimes for each county over time with trends and crime rates. The data on clearance rates and number of crimes was downloaded from the California Department of Justice web site  and the crime rate chart is from the Public Policy Institute of California.
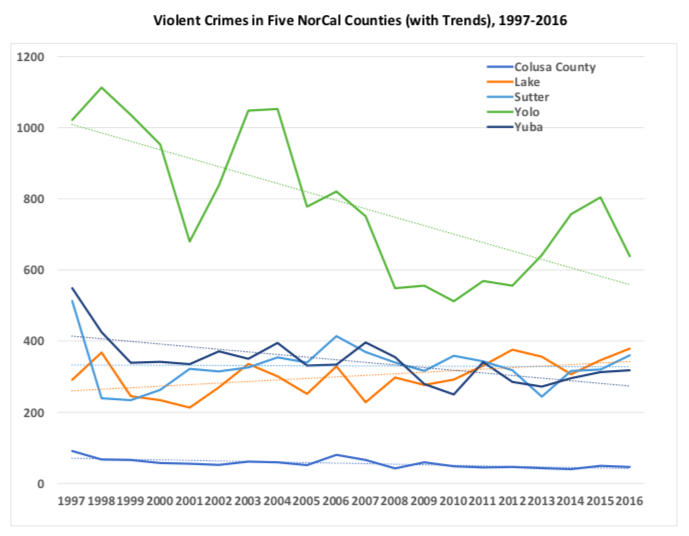
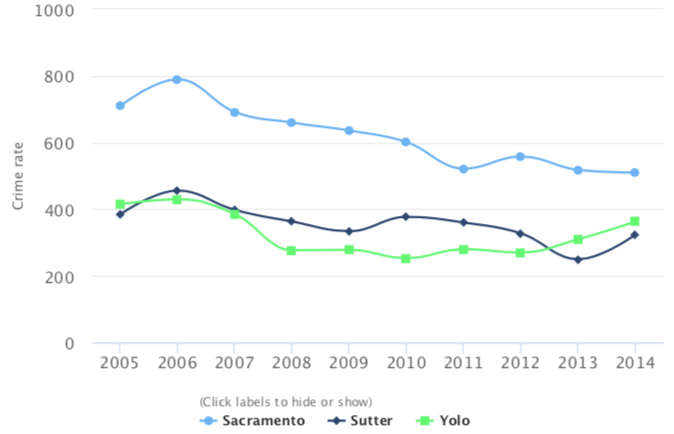
It is fair to say that the results for Yolo County during DA Reisig’s terms have been mixed. It is not accurate to assert that the crime rate has gone down steadily since he came into office. The number of violent crimes has declined overall but has shown some variability since 2006, with a significant increase between 2012 through 2015. The overall crime rate itself has increased in the past few years, while the rate in Sacramento County has shown a steady decline and Sutter County has generally gone down with a recent uptick. Yolo’s overall crime rate is almost back to where it was when Mr. Reisig took office in 2006.


A statistical sample of comparative countities was constructed by a faimilar name to us us, now taking the ancilliary role of a statistician. She seeks an “objective argument” to argue something.
The comparative sample size was chosen (and then acknowledged as having numerous inherent flaws). The tally, analysis, summation and conclusion was also provided by this same statistician, with data and graphs supplemented.
One of the fundamental norms stressed with any facet of statistical research is that the persons(s) involved have no personal investment in the findings. The phrase, statistical bias, is preached repeatedly in all courses of instruction for statistical analysis. This statistician apparently felt unburdened with that requirement because she’s anything but unbiased when it comes to Jeff Reisig.
The findings were reported as being were “mixed.” Yearly statistics of crime patterns showed the DA’s approach to public safety and have reduced crime in Yolo County in a sequence of years. This runs counter the researcher’s miltiple appeals to vote for Reisig’s opponent. She should be commended for being fair and objective, and now perhaps conflicted.
“Yearly statistics of crime patterns showed the DA’s approach to public safety and have reduced crime in Yolo County in a sequence of years”
No they haven’t. Correlation does not prove causation, you know that as well as anyone. At best the yearly data show that Yolo has largely trended along with the state of California.
I agree with Phil, as soon as I saw who the author was I pretty much knew where the article was going.
I did a similar analysis comparing Yolo to the State and Kern County (the county with the next highest trial rate). Again, we can see that the Yolo has underperformed compared to the state and another county. You can go and select any other counties that you would like, and most likely you will find that Yolo has not seen an exceptional drop in crime rates, and in fact appears to have an increasing rate compared to other counties.
But what’s most important about this is not whether Yolo’s crime rate is increasing, but rather you can’t show that it has improved in any comparable rate since 2007. Yet the DA has poured more resources into criminal proceedings than any other county prosecutor in the state, and has absolutely nothing of substance to show for foolishly spending our tax money. Why isn’t there more outrage from the taxpayers’ association about this profligate spending?
“Why isn’t there more outrage from the taxpayers’ association about this profligate spending?”
In part because of the nature of such organizations and in part because of the discreet nature of such spending.
As the person (RDC) who found the numbers that Tia presents, I think it’s fair to say that the numbers speak for themselves. Strong assertions have been made in the the last week about the effectiveness of our current DA in reducing crime. A commenter (JM) the other day said crime has gone down every year since Mr. Reisig took office.
As opposed to the absolutist arguments made by some that he is either all good (I think the word “progressive” has been used) or all bad, the numbers presented here, I believe, argue that 1) crime goes up and down; 2) Yolo County has more crime than nearby smallish counties (and less than close by urban counties); and 3) County crime rates have been going down all over the region.
These two charts and the table simply illustrate that people ought to be conservative in their comments and back them up with data. If JM, or others, want to show me the numbers to back up the assertion that crime (in general) has gone down in Yolo County since Election Day in 2006, I’d be happy to take a look.
“I knew when I saw who the author was where the article was going”.
Wow. Now that is funny. Robert pulled and posted the data I requested and I emailed it to David, with a minimum of comments. This was not” a hit piece. The data shows, as confirmed by Robert, that Yolo county has largely trended along with the other chosen counties. What it does show is that there is nothing exceptional about the performance of Yolo County as compared with the others.
So Robert gathers data that I request, I post it, and you all decide that it is me making stuff up. I am surprised and a little flattered that anyone, having commented frequently on pieces in which I have stated I have zer0 statistical knowledge, and less than zer0 ability to manipulate same into graphs would have thought that I had any ability to do this.
But fine, have fun with your presuppositions.
Tia is spot on here – Yolo trends with the rest of the state. Obviously I’ll have to pound this poin somemore.
I want to say something about perspective. I trained in a discipline in which we are expected to look at current best practices, adopt them, and then track improvement. We combine this with a constant effort to do better. This is how medicine progresses. It is the fact that we know we make mistakes and are constantly seeking ways to minimize errors and improve outcomes that allows us to make progress. But we are not uniform in this practice. Large integrated systems are best at this. Systems such as teaching hospitals, the Mayo, Kaiser tend to excel. This is what has led to progressively less invasive procedures such as laser & laparoscopic surgery. It is what has allowed California to drive down our maternal mortality rate to the lowest in the country.
I do not see criticism as “hatred” whether of fallible doctors, or fallible police. When there are suboptimal outcomes, we should be looking for places where a different type of intervention would get us a better outcome. That is all I am after.
Eric, maybe you should look closer at the table. The data suggests that all the counties (like the rest of California) has seen a decline crimes since the 90’s. I think most folks who follow these sorts of trends would argue that it is unlikely that the election of one DA had much of an effect on crime rates. There are much larger issues in action here.
On this one, I pretty much find myself in agreement with Phil Coleman. Citing a few arbitrarily selected statistics covering the period a DA was in office is pretty much useless in evaluating the effectiveness of the DA in reducing crime. For one thing, as David notes, correlation does not imply causation. The DA may have little, if any, influence on the crime rate. It’s my understanding that “clearance rate” is basically the number of arrests (or solved crimes) in relation to the number of reported crimes. That’s, perhaps, a measure of police effectiveness, but not the DA’s.
There are many sources of statistical bias, including bias in what variables are included, how the sample is selected, or how the results are interpreted. The oft-cited quote–popularized by Mark Twain but usually attributed to Benjamin Disraeli–often applies to instances where amateur statisticians, or those with an agenda, cite statistics, and would seem to apply here: “There are three kinds of lies: lies, damned lies, and statistics.” And note: This comment is directed at those who cite these kinds of crime statistics on both sides of the pending election.
Great post.
Eric and Phil,
The DA claims to be “tough on crime” by increasing the number of cases taken to trial. Reisig is claiming that he can show the causation over correlation. And the statistics shown are not “cleared” cases, but rather the actual crime rates. Increased convictions are supposed to be a strong deterrent to crimes, regardless of clearance rate. If we can’t show causation, then why do we pursue this strategy? If we are not going to measure the effectiveness of this strategy by looking at crime statistics, what is the metric that you propose?
Mr. Reisig’s supporters show statistics that are completely out of context–yes, crime rates have fallen on Yolo since 2006, but they have fallen faster almost everywhere else. That is the type of amateurism that should be called out.
(And by the way, I present statistics of these type professionally.)
Being “tough on crime” (whatever that means) is not the only, or most important standard by which a prosecutor should be evaluated. Governing based on fear and intimidation may get the crime rate down; but that’s not the goal of the criminal justice system. The American Bar Association’s Criminal Justice Standards for prosecutors says, for example, that the function of the prosecutor “is an administrator of justice, an advocate, and an officer of the court; the prosecutor must exercise sound discretion in the performance of his or her functions. The duty of the prosecutor is to seek justice, not merely to convict.”
So, I’m not overly impressed by statistics on the number of cases taken to trial or the number of convictions. I want a prosecutor that sees his or her primary function as ensuring that justice is done. I’m not sure our current DA sees that as his role.
This is the interesting part for me, “The duty of the prosecutor is to seek justice, not merely to convict.””. Most DA’s see their goal, not duty, as a high conviction rate. That leads them to plea bargain relentlessly and drop cases (“DA Reject”, music to an inmate’s ears) that seem to be risky. There is much criticism of the incumbent due to what is represented as a high trial rate. I know from experience that DA’s in other jurisdictions avoid trials for their own selfish reasons that have nothing to do with seeking justice or saving the taxpayers money.
I don’t see a high trial rate, in itself, as a bad thing.
I agree here Jim. If seeking justice, then isn’t the higher bar to take the case to court? In court there is a judge and a jury of peers.
I have always had a problem with plea bargaining. It seems almost immoral… a form of blackmail and abuse of power. “If you don’t accept this plea you will risk a worse result!”
How is that true justice?
I have never liked the practice and it appears that DA Reisig also does not like the practice. I believe that is a better approach for a DA… and to be lauded as it goes against his self-interest for having a higher trial success rate.
This is disingenuous hogwash but more so because it lacks crime per-capita and it also leaves out property crime which I know Davis liberals believe are not really crimes because Marx says so.
The other point to consider here… maybe if Reisig was not spending all this time and money on all these outreach programs that Davis liberals like to see, and instead he was just putting more people in jail that deserved it, we would see even lower crime levels.
Tia and David are arguing out of both sides of their mouths… saying that Reisig is guilty of over-charging while also saying that he isn’t tough enough on crime. Sometimes the infection of political bias provides very clear lack of credibility.
Jeff, the last chart is crime rate, the standard way of measuring crime (number of crimes over population). And it is overall crime – violent and property.
I’ve never said he isn’t tough enough on crime. And Jeff, you’re not addressing the data, you’re making an emotional argument.
How can I be making an emotional argument when I don’t have any feelings?
Robert, got it. That was not clear to be at first read. Thanks.
Clearly the DA trend line for Yolo is down and down at a steeper angle than the other counties compared. Looks like Reisig took over for a Johansson-type DA and cleaned up the mess.
The overall crime-rate is interesting given the last few years of Prop-47 and Prop-57… both opposed by Reisig (for good reasons) and the result has been an increase in larceny and property crime up and down the state. But the trend line before these mistakes of liberal CA voters is steeper down than the other comparisons.
I think you shot yourself in the foot with this data.
Jeff, no one (for emphasis – no one!) I know would describe Jeff Reisig’s predecessor Dave Henderson as a “Johansson-type DA.”
I don’t know how to put a chart in the comments, but the raw number of property crimes and burglary are down over the last ten years in Yolo. The trends (as reported by the California DOJ) for aggravated assault and robbery are essentially flat. But, then, these are the trends across the state, despite the Propositions you cite. If you have other numbers for property and larceny crimes, I’d be happy to see them.
My point, Jeff, is to suggest that answers to what makes crime go up and down are 1) complex; and 2) as I think Eric Gelber pointed out above, probably not due to the DA. Glib, blanket assertions don’t really serve the public interest and often muddy the waters, in my opinion.
And of course, there seems to be an election going on.
Jeff
“I think you shot yourself in the foot with this data.”
When Robert looked up the data for me, I had absolutely no idea what we would find. I wanted to look into this to see if you were right since you had posted your view that Reisig was doing a superior job with no documentation. That was my sole reason for looking. What I found was unsurprising. By these measurements Reisig’s performance ( or Yolo county crime statistics) have been well within the norm. Not terrible by comparison, but certainly not exceptional as had been opined. That was all. I just wanted some supportive data which you refused to provide.
So, you either found truth, correlation, or reinforced the concept of “confirmation bias”… I’ll not judge… you apparently have…
Howard
I would suggest that I did none of the above. Robert presented data. I suggested that it did not show exceptionalism one way or the other. And as far as “judging” I believe we all do. That is how we decide how to vote.
So… no truth, no correlation, no confirmation bias… got it…
No Howard you don’t “got it”.
“Truth” was not part of this article as statistics are always subject to interpretation.
“Correlation” Depends how you want to interpret it. Some would focus on the comparative numbers, some on the trends of each county over time, some on comparison of the various counties.
Confirmation bias – I have stated my bias overtly in previous posts. That is not what this rather non committal article was about.
There is also “relevance”. We could look at the patient ten year survival data of different groups of physicians to see which group are better doctors.
Pediatricians have significantly better survival rates than Oncologists. Therefore Pediatricians are more skilled than Oncologists and should be paid more as they are creating value.
Nice illustration of comparing apples to oranges. I truly hope that last paragraph was written tongue in cheek.
It’s called “pay for performance”