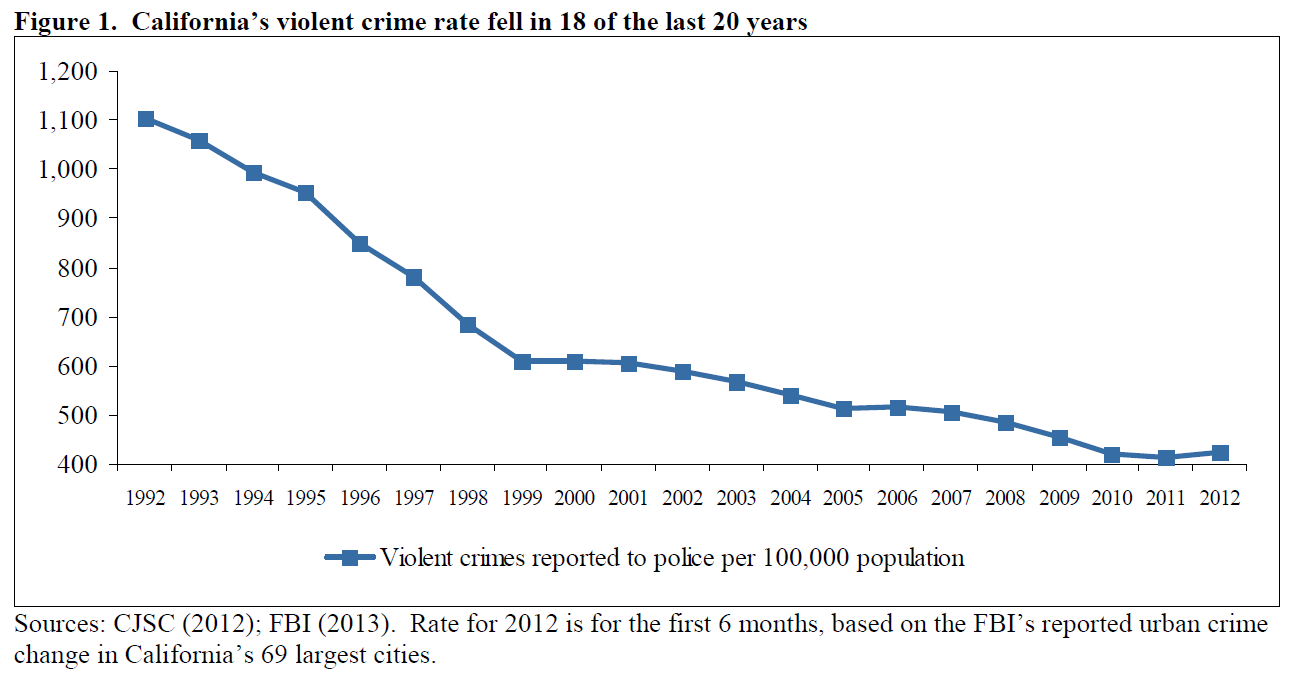
 California’s violent crime rate has fallen steadily since 1992, including a 63% decrease from 1993 to 2011. However, budget pressures have forced California to re-think how they handle crime, and preliminary information from the FBI shows that both violent crime and property crime increased slightly in most large urban areas in the first six months of 2012.
However, the overall trend remains overwhelming – violent crime remains at about the lowest levels recorded in the past 40 years.
One of the questions, however, is whether realignment is to blame for the small increase in crime in 2012. That is the subject of a January 2013 report from the Center on Juvenile and Criminal Justice written by Mike Males, a Senior Research Fellow, and Lizzie Buchen, who directs Policy and Communications.
“Realignment effectively divided the state’s felon population into two categories: those legally-defined as violent, serious, and/or sex offenders (around 207,000 as of June 30, 2012) who continue to be sent to state prison and be supervised by state parole officers upon release, and those lower-level offenders (approximately 46,000) who formerly were managed by the state prison and parole system but now must be managed by local justice systems and supervised by local probation officers,” the researchers write.
The question is whether the 46,000 offenders that were diverted to local management “contributed to the increase in urban offenses in the first half of 2012.”
The researchers found, “The data analyzed did not demonstrate any relationship between the implementation of Realignment and increases in violent or property crime.”
“Some critics of the policy charge that this new responsibility for counties may be leading to an increase in violent and property crime rates, which have risen since Realignment’s implementation. However, CJCJ’s analysis finds no connection between Realignment and these crime trends,” they write.
“If Realignment contributed to the increase in violent offenses reported to city law enforcement in the first half of 2012, one would expect counties with higher percentages of realigned offenders to show the biggest increases in violent crimes,” they argue, noting that counties have implemented the policy at varying rates.
According to their data, about 40 California cities showed an increase in violent crimes compared to the first half of 2011, while 29 showed decreases in violent crimes.
The 11 counties that implemented realignment the least managed about 15.5% of their formerly state-supervised offenders and parolees. The 10 counties that implement realignment the most often were managing around 22.5%.
Their analysis found that in the 11 counties that implement it the least, there was a 5.7% increase in violent crimes and 9.8% increase in property crime. At the same time, the highest realignment counties averaged just a 3.3% increase in violent crime and a 7.3% increase in property crimes.
“Realigning more prisoners, then, was not connected to increases in crime.,” the researchers conclude. “For example, Sacramento County and Alameda County, which have similar urban populations and realigned at similar rates, saw sharply different increases in violent and property crimes. Further, 5 of the 8 counties showing decreases in urban violent crime in 2012 had larger than average percentages of realigned offenders. The city of Los Angeles showed a substantial decrease in violent crime in the first half of 2012 (down 7.9%), which, according to figures from the police department, persisted throughout the year and into 2013 (LAPD, 2013).”
The researchers argue that, while “critics of realignment such as the Criminal Justice Legal Foundation cite anecdotes and assertions to charge that ‘mounting number of murders and other violent crimes’ are ‘occurring as the result of Governor Jerry Brown’s Public Safety Realignment,’ ” the analysis of the data “do not support these alarms.”
“Realigned offenders managed by local jurisdictions do not appear disproportionately responsible for reported crime increases in 40 California cities in the first half of 2012. If they were, one would expect counties with higher proportions of realigned offenders to show larger increases in violent and property crime than counties with fewer realigned offenders,” they argue.
They do argue, “Many factors influence crime rates, and the possibility remains that Realignment is one of them. It is important to note the data analyzed in this report represent only the first six-month period of Realignment, therefore the question should be revisited as more data become available.”
They add, “Understanding why some California cities showed increased violent and property crime in early 2012 and others showed declines, and why counties continue to show such wide variation in their implementation of Realignment, require further, careful analysis.”
Vanguard note: While it is probably accurate to say is that realignment is not causing the increase in crime, but it may still, as the researchers acknowledge, be playing a role in it.
A possibility is that realignment may interact with other changes. One area to look at is cities that have had to, due to budget cuts, cut police positions. Some of those cities, like Stockton, have seen dramatic rises in violent crime that some think is attributable to cuts in police personnel.
It is possible that, with more rigorous methodology and multivariate rather than bivariate analysis, interactive or enhancement effects may be occurring even if other factors may, on a one-to-one basis, be more influential.
On the other hand, we note that, as the graphic shows, as a whole crime is well down and we should probably assess multiple years before concluding this is anything other than a blip in a much larger trend.
—David M. Greenwald reporting


David could you link to the report you analyzed here?
One point that bears noting is that counties are using different approaches to “implement” realignment. You summarized the California ACLU report in March last year that raised questions about [i]how[/i] counties were implementing realignment and ended your article with this quote from the ACLU’s report:
[quote]“At best, counties will meet realignment with a commitment to reducing over-imprisonment, to protecting public safety, and to wisely allocating limited resources. At worst, counties will react to realignment as a mere transfer of authority over bodies – and simply incarcerate people convicted of non-serious, non-violent offenses at the local level now that cannot be shipped off to state prisons. Despite spending millions of taxpayer dollars on jail expansion, those counties will quickly see the same inexorable overcrowding and high recidivism rates that the state prison system has produced.”[/quote]
So, it is not merely implementation, or implementation timing (early/late) that would seem to matter, but also the specific strategies used.
Also, it is still not clear to me where Yolo County is in terms of whether it is using evidence-based alternatives to incarceration or merely adding more jail beds and hiring more Sheriff’s deputies. Maybe you could run a story on this.
Here is the Vanguard article from March 22, 2012
[url]http://davisvanguard.org/index.php?option=com_content&view=article&id=5201:aclu-report-looks-at-realignment-policies&Itemid=100[/url]
It is linked and here is the link as well ([url]http://www.cjcj.org/files/California_Urban_Crime_Increase_2012.pdf[/url])
Your suggestion is good idea.
DG: [i]”California’s violent crime rate has fallen steadily since 1992, including a 63% decrease from 1993 to 2011.”[/i]
Of all the theories I’ve come across since violent crime started to fall over the last 20 years, the most intriguing is [b]the leaded-gas theory ([url]http://lexicondaily.blogspot.com/2013/01/americas-real-criminal-element-lead.html[/url])[/b]. From Kevin Drum, a journalist who has reported on the science: [quote] … if you chart the rise and fall of atmospheric lead caused by the rise and fall of leaded gasoline consumption, you get a pretty simple upside-down U: Lead emissions from tailpipes rose steadily from the early ’40s through the early ’70s, nearly quadrupling over that period. Then, as unleaded gasoline began to replace leaded gasoline, emissions plummeted.
Intriguingly, violent crime rates followed the same upside-down U pattern. The only thing different was the time period: Crime rates rose dramatically in the ’60s through the ’80s, and then began dropping steadily starting in the early ’90s. The two curves looked eerily identical, but were offset by about 20 years. [/quote]
[img]http://www.motherjones.com/files/Lead_Crime_325.gif[/img]
DG: [i]”… preliminary information from the FBI shows that both violent crime and property crime increased slightly in most large urban areas in the first six months of 2012.”[/i]
You can’t draw any conclusions over a 6 month period. The sample size is too small. If California’s violent crime rate keeps going up, and it bucks a larger national trend in doing so, then it’s worth asking whether our changed incarceration policies are playing a role in that.
It’s easy enough to find individual cases where Prisoner X was let out early due to the policy, Prisoner X on release committed such and such violent crime, and hence the policy led to that particular crime which would have been eschewed had we not had realignment. But a short uptick and various anecdotes don’t tell the bigger picture.