
In 2008 during the Davis City Council elections, incumbent Councilmembers Don Saylor and Stephen Souza ran on a platform that argued the city had a balanced budget and a 15 percent reserve. In those days prior to the collapse of the US financial markets, it was difficult to counter that the city only had the illusion of a balanced budget.
At that time there were the looming unfunded liabilities of OPEB (Other Post-Employment Benefits, mostly retiree health) and the pension crisis had not hit, even though we were warning in the spring of 2008 that the city budgeting practices were unsustainable and, sure enough, when the Great Recession hit that fall, the house of cards came tumbling down.
But, while the next eight years would bring cuts and even some reforms, the unstable house of cards was never repaired. If anything, it got worse due to benign neglect. City infrastructure investment would lag. Unfunded liabilities and retirement costs would soar.
And yet our accounting methods continued to allow yet another mayor in 2014 through 2016 to credibly claim that all was well, we have a balanced budget with a 15 percent reserve and growing resiliency. Mayor Dan Wolk would dub this “the Davis Renaissance.”
The underlying reality had not changed. We simply did not have the metrics or models to demonstrate the precarious nature of our city finances.
That is what makes our new budget so extraordinary. It shows a $7.8 million average annual shortfall.
The report concludes, “The average annual shortfall in funding is $7.8 million.” To put this into perspective, “this amount is roughly equivalent to the current 1% Measure O sales tax, or to a 6.0% utility users tax on power, communications and water/sewer/sanitation services, or to a $270 parcel tax.”
And this is still a low number, as the park maintenance cost remains a work in progress.
Mayor Robb Davis writes in a comment that “it is a sobering read.” The financial forecast section of the budget, he said, “points out how in each area of City infrastructure we are, over the long run, failing to cover maintenance costs. It provides an initial estimate of the size of a potential tax to cover all unmet/underfunded needs. It is an important read and the kind of analysis this CC has pushed for.”
This kind of sober analysis is the outgrowth of some heavy lifting behind the scenes. Earlier this year, we presented the modeling of Project TOTO and the work of Matt Williams, Jeff Miller and Bob Fung to give the city a tool in which to see how decisions about funding can play out into the future.
The city then hired Bob Leland, who further refined the process to give the city real long-term forecasting tools whereby, as Matt Williams put it, “decisions that the Council and the Community face can be examined in the light of the tradeoffs associated with the decision alternatives.”
The city is to be commended for embracing this approach. No longer can the city hide the true cost of doing business or our true deficit by placing key items like unfunded liabilities or infrastructure needs into an unmet needs category which is off-budget.
The analysis, however, is sobering and we have tough decisions now to make in order to rectify the situation.
One big source of trouble, unsurprisingly, comes in the form of pension costs which the city projects to triple in the next 20 years. Think about it, back in 2000-01, the city was paying less than half a million dollars for pensions. By 2038 that number will be $18 million. To put this into perspective, $18 million is one-quarter of our current general fund budget.
Part of this problem rests with CalPERS (California Public Employees’ Retirement System) itself, which for years relied on unreasonable growth associations in the long-term combined with risky investments.
But that analysis ignores the role that city council level decisions played in this. It was the city council that voted to expand the firefighters’ benefits to 3 percent at 50. It was council that from 2004 to 2009 had double-digit pay increases across the board, including a whopping 36 percent increase for firefighters. It was the council in 2009 that dragged its heels on pension and OPEB reforms and salary concessions.
Most importantly, from 2005 to 2012, the council made the decision to prioritize compensation to employees over investment in critical infrastructure. During that time, council put almost no general fund money into road repairs, for example.
The result is that, by 2016, Nichols Consulting projected a 20-year need of $167 million – or $8.3 million annually – for road repairs.
Currently the forecast “assumes that 66% of street costs and 65% of bike path costs, or nearly two-thirds of this need will be funded through a combination of sources: General Fund ($3 million annually ramping up to $5 million in the 2030’s with 85% going to streets and 15% to bike paths), construction tax ($130,000 annually), development fees ($800,000 annually), and the new SB1 gas tax money ($441,000 in 17/18 and $1.56 million annually thereafter).”
Even with these added expenditures, roadways in Davis after a momentary uptick will regress back down to PCI (Pavement Condition Index) 60 by 2035.
These are all choices that the council made, but the advantage of this modeling is that we now get to know the consequence of our choices and we can decide what our priorities ought to be. Do we shore up our infrastructure or continue to pump the bulk of our spending toward retirement benefits for current and past employees?
These choices are now ours – but thanks to transparent models that forecast our expenditures, we get to make them consciously.
—David M. Greenwald reporting


I am not deep in the weeds of this, but extremely concerned nonetheless. I’ve looked at the financial forecast, some of Project Toto’s presentation and read your previous article.
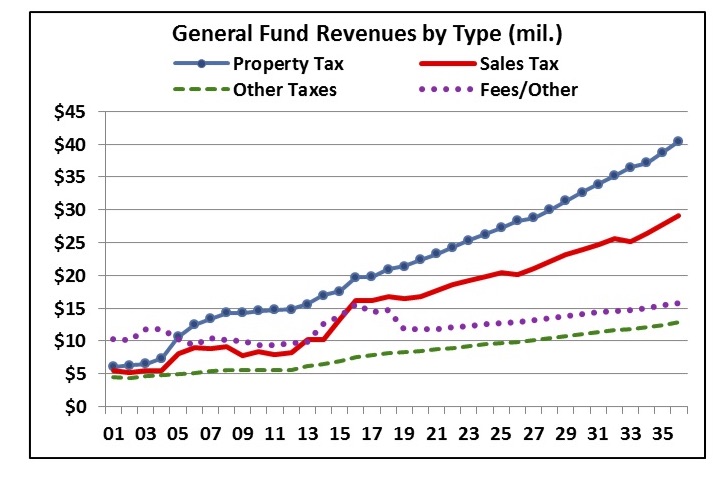
The question I have is, how is Davis similar or different to “comparable” cities in the sense of revenue and expenditures. I’m struck by the graph on page 4-3 of the Financial Forecast where I see a significant change in the proportion of various revenue streams. Fees/other were the dominant source 15 years ago and Property Tax revenues were comparable to Sales Tax. This was during our (apparently) fiscally healthy years.
We’re coming into a period of 8 million dollar per year deficits. If the sales tax revenue gap compared to the property tax revenue would return to its ratio of 15 years ago (by other than transportation industry, which is said to be volatile) it seems we would not be having these problems.
I don’t want to close only with revenue, but it seems we will be discussing another parcel tax. And, we have to realize the point Matt Williams made in a previous article – that parcel taxes for the city crowd out parcel taxes for the school district. The District staff has also presented a bleak assessment of its revenues for the next 3 years.
At its base, I ask, why can’t an apparently wealthy city like Davis sustain its services in a fiscally responsible manner?
This is a great question that unfortunately has a very simple answer. We cannot function in a fiscally responsible manner because we refuse to implement the fiscal changes necessary to do so. The primary issue is one of revenue, specifically the lack of revenues from business operations and retail sales. This is a long-standing problem that has existed in town for decades.
If we look at the Davis General Plan of 2001 we see that in 1995
The situation is largely unchanged today, as Davis continues to lag behind most comparable cities in the State in per capita sales tax revenues. Sure, we reluctantly added the Target complex ten years ago, but that is the only significant change that we have made and the store size restrictions and non-competitive policies placed in our Municipal Code remain. Instead of growing our revenue base by expanding retail opportunities around town as was outlined in the General Plan more than two decades ago, we continued to focus on maximizing the land value for downtown property owners and protecting certain downtown businesses from competition. This reality was really brought into focus when the Planning Commission and City Staff recently approved a plan by one of the principal beneficiaries of these protectionist policies to redevelop their prime downtown gateway property into a private parking lot, instead of the multi-story mixed-use building envisioned in our zoning regulations and specific area guidelines. How much potential revenue did the City give up with that short-sighted decision?
The situation with our general commercial space is much the same. From the General Plan, we learn that in a 1996 economic analysis done for the City that: “Davis could accommodate 200 to 250 gross acres of industrial growth through 2010.” Yet, despite multiple years of community visioning and task forces we have failed to follow through with any significant expansion of our industrial base. This has been discussed multiple times here on the VG and there really is no value in digging into it again now. We here in Davis are fairly competent at identifying our fiscal shortfalls, but unfortunately, we are completely incompetent at actually implementing the necessary solutions to address those shortfalls. Until that changes, Davis will continue to fail at being a responsible, fiscally sustainable City.
@Mark, thank you very much for that analysis – it echos my suspicions and, honestly it is sitting there in that graph.
I want to point out to you (and other VG readers) that, while this (and many other issues) are discussed frequently on the VG – and, of course, at council meetings – I think the message is not making it to the larger population in town.
In particular, I talk to my friends with young families and they don’t understand the fiscal scenario in Davis – we “long termers” have a lot to lose if we don’t understand the projections 10-20 years hence. Only small fraction of the population is able to pay close enough attention to this issue – and they do read the VG and go to council meetings.
However, much of the attentive t population seems to be the “stranglers” as I will call them – those who, under the cover of “smart growth” actually wish to (and succeed at) strangling all growth.
A synopsis of the city’s current fiscal situation should be sent out to everyone in town. I mean that – good ol’ fashioned paper fliers or whatever. I urge the VG to to find some sponsors actually go PAPER for this one so you can reach the whole city with this issue – and at the same time advertise the VG to the broader population (and grow the market for the VG).
The city went through a long process of discussion and planning for three business parks. The sites were chosen, requests for proposal went out, and three proposals came forward. One gave up and went away. One tried to modify it and gave up when they couldn’t. And one got voted down.
Joseph Biello said . . . “The question I have is, how is Davis similar or different to “comparable” cities in the sense of revenue and expenditures. I’m struck by the graph on page 4-3 of the Financial Forecast where I see a significant change in the proportion of various revenue streams. Fees/other were the dominant source 15 years ago and Property Tax revenues were comparable to Sales Tax. This was during our (apparently) fiscally healthy years.”
The question you ask is a very good one, and it has a number of moving parts. First, the category of fees/other is very dependent on construction activity. The bumps you see in 2002-2003 and 2014-2018 represent periods of high construction activity. The future period shows the baseline non-construction activity level of fees with an annual inflation factor applied by Bob Leland.
Second, the category of sales tax has seen the two noticeable upticks as a result of the passage of the incremental 0.5% local component and 1.0% local component. I personally believe the red line in the graph should parallel the fees/other and other taxes trend lines, which would substantially reduce the sales tax revenues in the years going forward. Why? Unless the State changes its laws, the local component for any Internet purchase delivered to a Davis address does not flow to Davis. It goes to the location of the shipping warehouse. As a result our base of local revenues from retail sales is eroding. The sales tax from restaurants will grow, offsetting the loss of retail, but that leaves us (in my opinion) with only the same inflationary growth trend you see in the fees/other and other taxes trend lines.
Third, growth in property taxes is not dependent on activity . . . and the baseline inflation factor (under the provisions of Prop 13) is almost always bumped up each time there is an actual sales transaction. So, the bottom-line of that is that the property taxes proportion will get larger over time.
.
Matt, thanks for your careful analysis and responses.
Do YOU have a sense of how we compare, either to the other cities in the county or other college towns? Or, other “slow growth” communities.
Joseph, I have not personally done that kind of comparative analysis. I also do not know of any comparative analysis that anyone else has done on that subject.
I will be glad to sit down with you and discuss this issue. Feel free to e-mail me at mattwill@pacbell.net if you want to get together.
Joseph,
All good questions. Perhaps if more of our residents begin asking why – the city will begin responding with more in kind information.
With due credit to FBC almost no other jurisdictions operate with a comparable degree of transparency.
David Greenwald said . . . “One big source of trouble, unsurprisingly, comes in the form of pension costs which the city projects to triple in the next 20 years. Think about it, back in 2000-01, the city was paying less than half a million dollars for pensions. By 2038 that number will be $18 million. To put this into perspective, $18 million is one-quarter of our current general fund budget.”
One of the important questions that this new era of improved disclosure brings to the fore is how to look at the $12 million increase in the amount the City is annually spending on employee pensions. Is that $12 million an increase in Salary and Benefits paid to employees? Is that $12 million part of the Average Annual Real Pay Per Employee calculation?
The difficulty with those two questions is that none of that $12 million appears in any of the current employees’ pay checks, so when their representatives sit down at the collective bargaining table, they are going to want to treat that $12 million as “off the books.” That argument, and the response of the City’s negotiators, can be best be described as a conundrum . . . for the employees, the City, and the citizens/taxpayers alike.
I would argue that it is a conundrum that we, as a community, need to discuss openly and collectively and actively.
One key, is that the big number on pensions/OPRB, also reflects the same wrong attitude as to streets/bikepaths, facilities, and other funding… ‘deferred maintenance’ as it were… done as a pay as you go/minimum amount absolutely required thing… the City is playing “catch-up” with all these.
Had the City been putting (then equivalent of) $3 million a year into road maintenance repair when the problem was first identified and presented to the CM/CC in the mid-80’s, the “hole” would be a lot shallower. And relatively easy to deal with.
Same principle applies to pensions/OPRB… for many, many years, the City paid NO employer contributions to PERS. The City was told they were ‘super-funded’. Had the City still put the ‘normal’ contribution rates into the City’s account, we would probably not be too concerned… but the fact is, the City did not…
Points very well taken Howard. I agree with them in principle . . . strongly agree with them.
Unfortunately we can not turn back the clock and have a re-do on the decisions that resulted in deferred maintenance of our capital infrastructure. We can not turn back the clock and have a re-do on the decisions that underfunded the pensions. We can not turn back the clock and have a re-do on the decisions that granted unsustainable increases in employee pay.
We have to play the cards that we have been dealt . . . and we need to play them efficiently and effectively and openly.
Agreed. And steps have been taken to not dig deeper when one is in a hole… whether they are sufficient, I leave to others.
For new employees (not considered “classic” by PERS)[first PERS employment since Jan 1 2013], they have lower retirement plans (see PERS website)… “non-classic” employees of the City cannot expect 3@ 50 or 2.5@55… not eligible.
As to PREB, post 1996 +/- employees, when retired, can only expect a portion of medical benefit premiums paid by the City (~50%) until they become eligible for Medicare. All retirees, once eligible for Medicare can expect only “supplement to Medicare” coverage… key word is eligible… some city retirees, unless they are eligible under their spouse’s eligibility, are ineligible for Medicare. That number decreases over time.
‘Supplement to Medicare’ coverage premiums is much less than full coverage of health plan premiums. Have not seen that addressed in projections to date, but may be “embedded” in the analysis… just don’t know.
Facts. Not opinion. No advocacy.
Again, excellent points Howard.
You are very good at peeling back the onion.