In a column that appeared in the Sunday, September 1, paper, Bob Dunning writes that he sent a note to Mayor Pro Tem Gloria Partida “asking what she thinks about our sudden move to district elections.”
Mr. Dunning notes: “The councilwoman did not mince words with her answer.”
“Several years ago the school district was sued and hired a demographer,” she began.
“The results showed no concentrated areas of under-represented folks.”
Bob Dunning then responds in his own words: “No surprise there. Whether it’s dumb luck or good planning, Davis does not have under-represented groups concentrated in a geographic area that could potentially constitute a voting district. As such, if under-representation exists, it won’t be fixed by district elections.”
Unfortunately the comment by Gloria Partida is factually incorrect. She told me that her email to Bob Dunning was based on a comment made by former DJUSD Boardmember Sheila Allen during public comment.
Moreover, Mr. Dunning apparently published these comments and furnished his own opinion without checking the factual accuracy of the statement himself.
The Vanguard verified the facts with DJUSD Public Information Officer Maria Clayton and what emerges from those facts is a vastly different story than the one told by Mr. Dunning.
The bottom line here is this: the district was not sued. The district did not hire a demographer. And the conclusion – not based on a demographic analysis – is at best dated and therefore not  applicable to the current conversation.
“I can verify that the District was not sued,” writes Maria Clayton in an email to the Vanguard.
Instead, what happened is that the district received a later dated November 16, 2011, from the YCOE (Yolo County Office of Education) Superintendent on behalf of the Yolo County Committee on School District Organization (County Committee). At that time, they made a request of each school district to reconsider whether they should move their election system from at-large to district elections.
Each district was asked to send a response by the end of February 2012.
“At its meeting on February 2, 2012, the Board received a presentation on the California Voting Rights Act (CVRA) from legal counsel that included his presentation, some initial reference maps, and a copy of a letter from YCOE,” Ms. Clayton stated.
After review and discussion, “the Board did not believe it had liability under the CVRA to require a transition to By-Trustee area elections.”
Importantly, they “did not hire a demographer to do a full assessment at that time.”
It is important to understand that this is not a letter of demand like the one sent by Matt Rexroad to the city. This was from the County Office of Education, simply requesting the district to make an assessment.
In addition to the factual inaccuracies on technical details, it is important to understand there is also a massive contextual error here. This occurred in 2011 to early 2012.
At the time, they were using data apparently from 2000 to evaluate whether to make the change, The presentation states, “If your District already elects ‘by-trustee area’ then your District should be updating its trustee areas using the recently released 2010 Census data.”
The elections it analyzed were from 1994 (Prop. 187 on illegal immigration), 1996 (Prop. 209 on affirmative action), 1998 (Prop 227. on bilingual education), 2003 Prop. 54, the 2003 Special Election and the 2006 Insurance Commissioner race.
Those elections now go back 13 to 25 years.
A further reason why the temporal context is so important – in 2012 when the district analyzed whether it should go to district elections, they made the determination, absent a formal letter, that they did not have liability. Seven years later, the district re-analyzed the data and came to the opposite conclusion.
You might ask yourself, what changed? And the answer is: a lot. The unwritten story by Bob Dunning, by the mayor pro tem, and really even by the school district and city is one of huge demographic change.
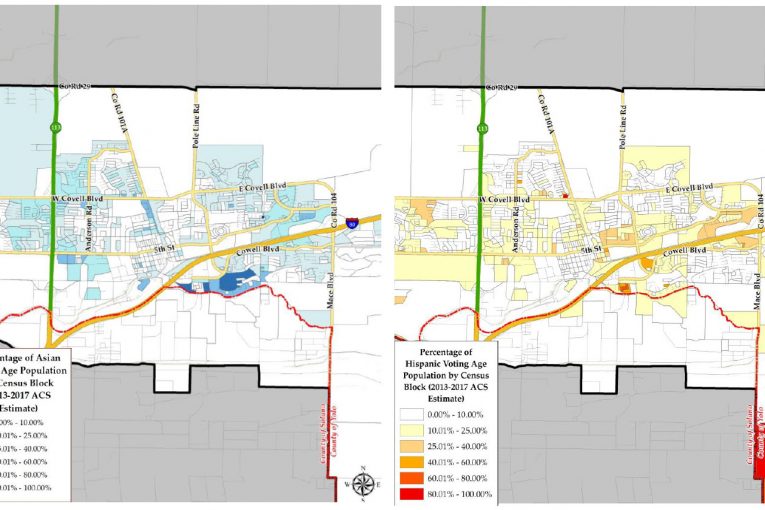
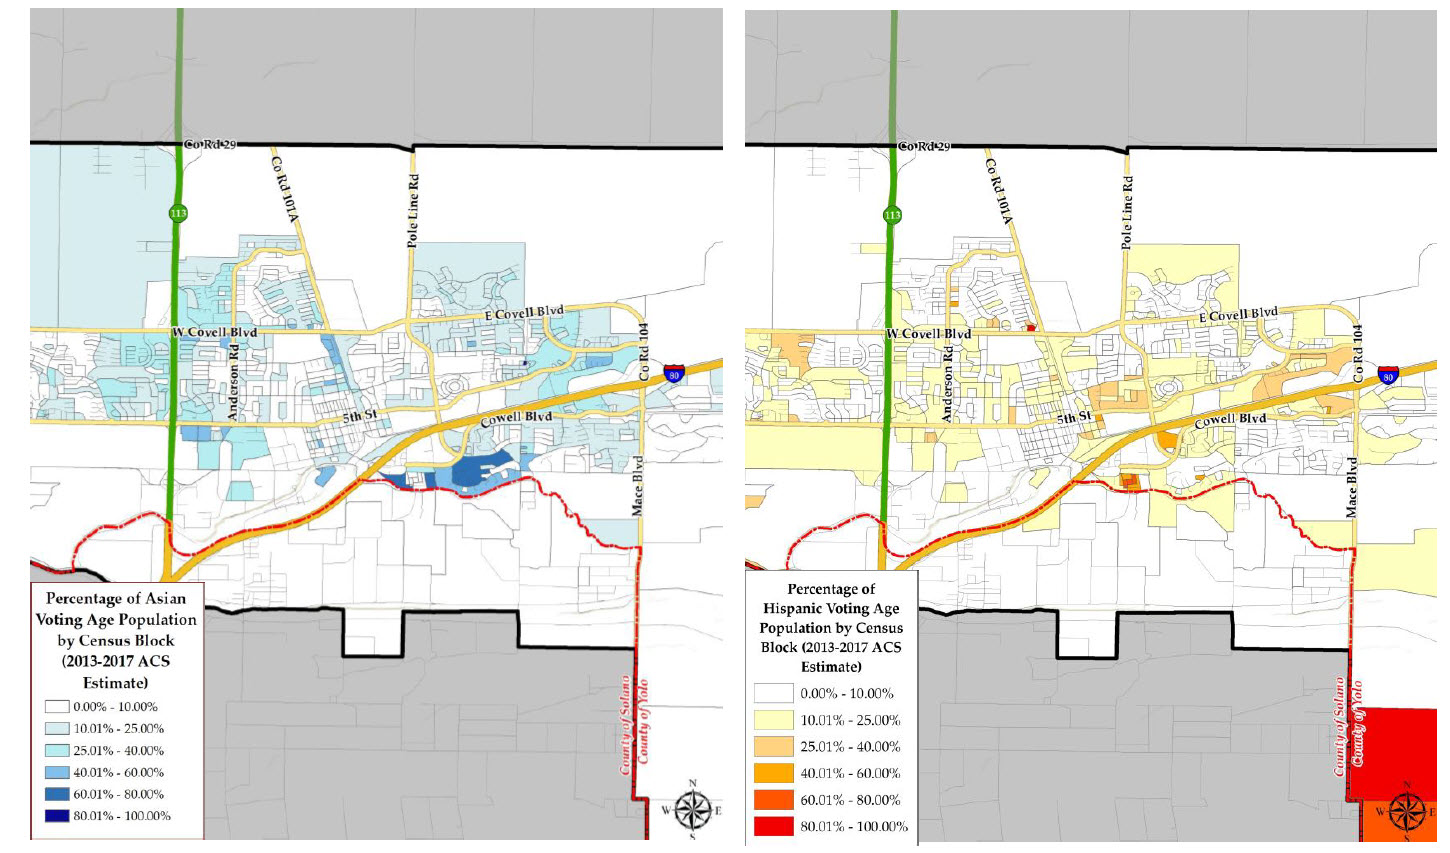
To illustrate just how much this has changed: a presentation prepared by Redistricting Partners on January 27, 2012 found that district in 2000 to be about 70 percent white in terms of VAP (Voting Age Population) – 2.4 percent African American, 18.5 percent Asian, and 10 percent Latino.
Using just the 2010 census data, last week, the district demographics showed the VAP as 58.2 percent white with 24 percent of the population being Asian and another 11.5 percent Latino.
That’s a huge change in a decade and the trend is only increasing the minority population.
The bottom line is the fact that the district in 2012 came to the conclusion they did not face liability and now, seven years later in 2019, they came to the opposite conclusion – this has everything to do with that rather large demographic shift in Davis over the last two decades that has moved Davis from about 70 percent white to current estimates of 55 percent white.
Thus, the unwritten Davis story here is one of demographic shift over the last two decades.
—David M. Greenwald reporting


Connect the dots:
Dunning previously criticized the author of this article [name redacted] for soliciting and accepting support from City Council members for a fundraiser
The author of this article has taken potshots at Dunning since then
The author of this article criticizes Dunning here, but there is a problem: Dunning is quoting a City Council member who apparently stated incorrect information
The author of this article solves this problem by not even mentioning the City Council member in the article headline and focusing his ire on Dunning.
The author of this article also states that Dunning has drawn the wrong conclusions, but doesn’t present direct information to contradict these conclusions (i.e., doesn’t actually show that drawing 5 to 7 districts would end up with concentrations of minority populations).
Let’s connect the dots…
Rik Keller doesn’t like David
Rik Keller doesn’t know much about the city
But Rik Keller doesn’t like David
Oh yeah he doesn’t like development much either, but since this isn’t about development, revert to, Rik Keller doesn’t like David
Rik
“The author of this article has taken potshots at Dunning since then”
Respectfully since it may honestly look this way to you, David has frequently disagreed with the writings of Dunning and has not been shy in saying so. Since the respective writings of David and Dunning have frequently had critical comments about the other, I think you are misattributing the current “potshots” as something unique to the post “council gate” era, when in fact, criticisms of said author have preceeded it by years.
Tia: I didn’t rule out the author of this blog [name redacted] having taken potshots at Dunning earlier. Just trying to place this in recent context, and look at why he would focus his ire on the messenger for Partida’s statement rather than on the Mayor Pro-Tem herself.
Also, I see a correction here, I don’t see any “potshots” – do you Tia?
It seems to me there’s shared blame here—Partida for not getting the facts right in the first instance and Dunning (and Enterprise editors) for sloppy journalism in not checking out easily verifiable information.
That’s my take and moreover what reading this column – it seems to say
Looks pretty black and white to me:
District wasn’t sued, they didn’t even get a “letter”
They didn’t hire a demographer
And it was an assessment from seven years ago using what appears to be nearly 20 year old census data.
So what am I missing?
That your two comments above are devoid of anything but a personal attack and will be removed? That perhaps?
David… thanks for the graphics… one (or two?) missing is voting age, eligible to vote (goes to citizenship/residency of record) Asians and/or Hispanics/Latinx.
I expect nothing, as the data may not be available, and/or it may not support your views/arguments…
WM, some of what you want may be found in this package from the demograhpher:
http://documents.cityofdavis.org/Media/Default/Documents/PDF/CityCouncil/CouncilMeetings/Agendas/20190910/07-District-Elections-Demographer-Presentation.pdf
The maps are CVAP – voting age population. I believe that means eligible, but at this point, we only have fairly limited data available.
Alan… appreciate the link…But still (that I saw) does not resolve for all four criteria: ethnic (self-identification?); location; voting age; voting eligibility (‘qualified’ voters) [yeah a bit of Venn diagram thing going on with the last two]…
But I truly do appreciate the link. Thank you.
I see I didn’t “parse” things right as to thread hierarchy… my bad…
Should have been under Alan’s 9:45 post. [dumb-thumbed]
I’m really not following the comments by Keller here.
The title is: “Errors in Dunning Column” – doesn’t specify who made
The first paragraph identifies both Partida and Dunning.
Third paragraph criticizes Gloria Partida for getting her facts wrong and the fourth paragraph Dunning for failing to check the facts.
The rest is an analysis of the issue that doesn’t discuss either person.
This is a “potshot”? Can anyone not named Rik Keller show me where the potshot is?
Wonder if everyone forgot about the subject of this column: demographics of Davis based on skin pigmentation and geography of origin. I accept David’s statement that things have changed and only have some math questions. If you’re going to bother to report numbers to the nearest tenth, everything should add up to the nearest tenth. To that end, I offer my own estimates for the 2020 census since we seem to be pulling numbers out of the air.
Grouping 2000 2010 2020
White. 70% 58.2% 50%
Asian. 18.5%. 24% 33%
Latinx. 10% 11.5% 15%
Black 2.4% — 2%
Total. 100.9% 93.7% 100%
Please show your math . . .
Or, we could just round to the nearest 10%, which yields some interesting results:
Grouping 2000 2010 2020
White. 70% 60% 50%
Asian. 20%. 20% 30%
Latinx. 10% 10% 20%
Black 0% 0% 0%
Total. 100% 90% 100%
Math . . . use it, abuse it!
And we can extend the trend-lines for each ‘pigment’ . . . and may I mention how amazing it is that no people inter-marry across pigmentations in these surveys – everyone one is so perfectly classified by race – my, my how the Klan would be so proud 🙁
Grouping 2000 2010 2020 2030 2040 2050 2060 2070
White. 70% 60% 50% 40% 30% 20% 10% 0%
Asian. 20%. 20% 30% 30% 40% 40% 50% 50%
Latinx. 10% 10% 20% 20% 30% 30% 40% 40%
Black 0% 0% 0% 0% 0% 0% 0% 0%
Total. 100% 90% 100% 90% 100% 90% 100% 90%
So, to that end, I offer my own estimates for the 2070 census since we seem to be pulling numbers out of our respective arseholes: In 2070, no blacks, no whites, 50% Asian, 40% Latinx, and 90% of people . . . . . something-ish!
Math . . . use it, abuse it! To death.