By David M. Greenwald
Executive Editor
Davis, CA – As reported last week the city, county and developer agreed to both a tax sharing agreement and an MOU. Critics of the project pointed out that the city’s fiscal impact had been projected to be $3.88 million annual at build out.
However, the revised figured was reduced with this agreement to about $3.64 million. A slight decrease.
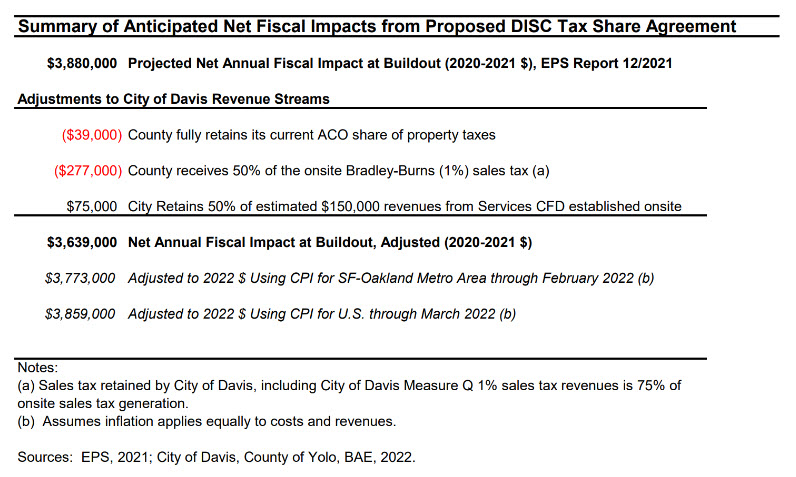
As the staff report clarifies, “The City net revenues at project build out after implementation of the above tax share allocations is $3,639,000 in accordance with BAE utilizing the EPS economic and fiscal
impact analysis as a base of analysis.”
However, some of that is simply accounting. Staff points out, “The EPS analysis figures  are expressed in FY 2021-2022 dollars. Utilizing the CPI index for SF-Oakland Metro, All Urban Consumers, the June 2021 index of 309.497 and February 2022 index (most recent available on BLS web site) of 320.195 results in an increase of 3.46% or approximately $3,773,000. This assumes inflation applied to all cost and revenue items equally.”
The report continues, “However, more recent increases nationally in CPI have not yet been incorporated into the published Metro CPI Index. The City’s consultant, BAE, utilized the national CPI data that is available up through March 2022 to arrive at a net fiscal benefit figure to the City of approximately $3,859,000 after accounting for costs, revenues, and the proposed tax share agreement terms.”
Basically, as one source put it, “there’s really no reduction at all”—“negligible and when you account for CPI adjustments since the EPS analysis was done it’s no reduction.”
As another source put it—the critics are “not entirely incorrect.”
Under the tax share agreement the city benefit does drop by about $240,000.
However, “the reason the city found this acceptable is because it updated the 2021 numbers used in the EPS report to account for inflation and, when they did that adjustment, the city is right back at $3.859 million. So no real loss below what was anticipated. And the county is happy.”
But actually there is a bit more here anyway.
“The Development Agreement calls for a CFD to be formed for the DiSC project specifically to create an additional revenue stream for community services and amenities beyond the project revenues already anticipated. Specifically, the DA calls for the creation of a CFD to generate a minimum of $150,000 per year at project build out.
“As part of the tax sharing agreement, it is proposed to share with the County the greater of 50% or $75,000 per year of revenues from the CFD specifically to go towards the maintenance, operations, or construction of the South Davis Library.”
Thus not only does the city retain half of the CFD that is estimated at $150,000 per year, but the other half “while technically going to the county directly benefits the city by way of helping fund the south Davis library.”
In short, even portions of money that go to the county directly benefit the citizens of Davis, specifically south Davis which has been wanting a library for some time.
As the source pointed out, “If you add in the $75K of CFD that’s going to the south Davis library (as a pseudo benefit to the city) it pushes it up to $3,934,000.”
Some will of course argue that the EPS analysis is overly optimistic. The Finance and Budget Commission voted to accept the EPS analysis as reasonable and, frankly, I have always believed that the figure is a low figure not a high figure.
Regardless, I have yet to see a workable alternative for revenue generation in the city that is not based by overly optimistic or, shall we say, magical thinking.


Ohhhhh, where to start? Let’s start with …
.
The small problem with that statement is that before the tax-sharing MOU was agreed to, that statement would have read City retains 100% of estimated $150,000 revenues from Services CFD established onsite So the MOU did not increase the City’s revenues by $75,000, it reduced the City’s revenues by $75,000.
So the total revenue reduction is $391,000 ($39,000 plus $277,000 plus $75,000) and the new projected net revenue amount is $3,489,000 ($3,880,000 minus $391,000).
.
That is neither “simple” nor “accounting.” The FBC has asked over and over and over again (for the DiSC project, and the WDAAC project, and both Nishi projects, and the MRIC project) to have the analysis with both the revenues and the expenses expressed in Net Present Value (NPV) terms, which would address the inflation issue, as well as several other issues. However, staff has consistently vigorously rejected the FBC’s requests each and every time that it has been made. EPS provided the analysis using constant FY 2021-2022 dollars because that is what their client insisted on. That isn’t accounting. That is finance.
The other aspect of the statement that is not “simple” is that a substantial portion of the City’s revenues are capped by the restrictions of Proposition 13. They can’t go up any more than 2.0% per year. As a result the aggregate blended average 20-year inflation rate for revenues reported in the Forecast section of the annual City Budget is 2.5%. That same Forecast projects an aggregate blended average 20-year inflation rate of 3.5% for City expenses because there is no cap on the inflation rate for expenses. That 1% differential between the inflation rate for revenues and the inflation rate for expenses causes a 10% profit margin to disappear completely and go negative in 11 years and become a 10% deficit in 18 years.
However the recent experience with respect to the expenses of the City has an inflation rate that is much higher than 3.5%. If one looks at the annual expense growth in rolling five year averages in order to avoid annual data anomalies, the annual average increases are as follows
2012-13 (covering the five-year period from 2007 through 2012) = 1.0%
2013-14 = 2.5%
2014-15 = 2.6%
2015-16 = 4.0%
2016-17 = 8.1%
2017-18 = 7.2%
2018-19 = 9.5%
2019-20 = 10.4%
The five-year rolling average for 2015-16 covers the period from 2011-12 through 2015-16. So from FY 2011-12 through FY 2019-20 the average costs increase has been consistently and substantially above 3.5%.
That is the message staff and City Council should be conveying to the public, not some 20/20 hindsight change from their rejection of the FBC’s recommendations to include inflation and NPV in the City’s financial analyses.
.
That is spin … pure and simple.
To illuminate just how much that is spin, let’s compare the tax-sharing agreement terms the County and City agreed to for Nishi and WDAAC with the terms of this DiSC tax-sharing agreement. In the Nishi/WDAAC MOU the Bradley-Burns portion of the Sales Tax is split 85% for the City and 15% for the County. In the DiSC MOU the Bradley-Burns portion of the Sales Tax is split 50% for the City and 50% for the County. Using the EPS analysis numbers in Tables B-11 B-12 and B-13 an 85%/15% split gives the City $180,000 a year more under the nishi/WDAAC terms than under the DiSC terms. That is a $180,000 give away plus the $75,000 giveaway of the CFD money.
I suppose this is a case of two opposing things being correct depending on interpretation. So yes, the city does not get the $75K. No cash goes to the city for it to use as it sees fit. But it does get some funding for a little library in Davis. So in one sense it does get the money back but in another sense it doesn’t because it was never cash which the city could use as it sees fit (like going towards the budget shortfall).
So do your own city project investment NPV calculation. It shouldn’t be that hard to ballpark one. NPV is largely more of an art than a science based on your ability predict revenue, costs and figure out a discount rate. Simply guestimate the timing of cash expenditures will be for services like fire, police, water, sewer…etc.. And then throw in the projected schedule of the realization of the revenue for the city. I’d apply a discount rate based on some amalgamation of interest rates city pays for it’s debt. You mention that tax revenues will be realized later (like in year 5 or beyond) but by my guestimates the real cash expenditures by the city for services to support DISC will also be realized in the later years too. Roads? The first servicing won’t be for 10 years…or even later (since not all the roads will be built on day one) and that will probably just be just a resealing…not major repair (not major cost). The more costly to service residential goes up only after a good portion of the commercial project is built (and leased I think)? So services for that part of project won’t be needed immediately. You could probably speak with police and fire to guestimate when they’d ramp up service in their budgets…in year 5+? Hire another police person? Another fire fighter or more likely some % increase of their budget based on new housing and commercial square footage? The same goes for additional water and sewer costs to service the project. Again, I don’t think these costs will be incurred by the city immediately and more than likely in the latter years of a 10 year project window.
The increasing costs the city has experienced over the past 10 years is interesting. It certainly warrants examination. I’m a huge football fan and love to analyze the game. This is what I tell fans that love to throw out stats. Stats are important. But context is everything. So in this case, I ask is there anything in the city’s budget in those years that created those cost increases that are isolated to those years? Was there a specific investment or one time expenditure? Is there reason to believe that there’s a baseline for city costs going forward that don’t include any one time or stand alone impacts on city costs?
I’m not sure I get what you’re saying? It appears you’re comparing DISC’s tax split agreement with the county to other project’s tax split agreements. Is this an apples to apples or an apples to oranges comparison? Because I do not believe Nishi and WDAAC are business parks with same kind of commercial component that DISC features. I’m going to guess that they aren’t going to be considered under the same circumstances that DISC (especially an active adult community). Are how these agreements with the county made a question for Don Saylor?