On Thursday, the Vanguard reported that even without a surface water project, the water rates would nearly double (97% increase) over the next five years. Without a surface water project, water revenue needs would increase by 80% while revenue needs would increase by 136% with the water project.
Further data and graphs from the city now allow for a more detailed analysis.
The caveat of the charts we are about to present is that they are based on figures for the fiscal year. However, the water rate impacts do not coincide with the fiscal year. The first water rate increase would be May 1, 2013. Beginning in 2014, the increases take effect January 1 each year.
But, as it was explained to us, the city has to budget by fiscal year, so it really does not make sense to show costs and revenues. That cannot be avoided apparently, so the reader needs to understand that fiscal year 2013-2014 will begin with one rate and midway through, switch to the higher rate.
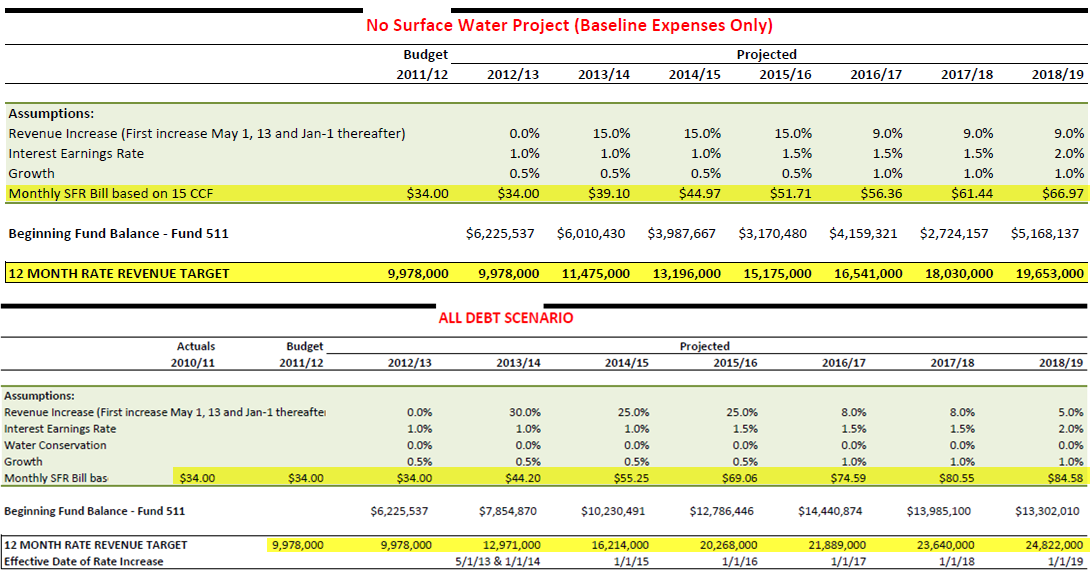
Here we see a side by side comparison of the revenue targets and the water rates for the no-project and all-d ebt scenarios. As we can see revenue increases from just under $10 million to nearly $20 million by 2018-19 in the no-project alternative.
In the all-debt scenario, we see an increase up to $24.8 million by the 2018-19 fiscal year.
What does that do to the water rates? The city uses 15 ccf (hundred cubic feet) as the baseline. For that water usage, rates increase from $34 up to $66.97. Compare that to the surface water project alternative, and the rates increase from $34 to $84.58.
The no-project scenario represents a 97% increase in year six, whereas the surface water project rates increase by 149%.
In essence, at least according to the city’s projections, the difference between the water project and no water project is about $18 per month or $216 per year. The tradeoff is that cost for higher quality water.
However, there is a caveat there. Under the current all-debt scenario, water rates will increase steadily from 2018 to 2038, with the revenue needed increasing from $24.8 million to over $42 million. So while, in the short term, the rate increases are only about $18 per month apart, we do not have a good sense of the cost for the no-project alternative in the long term.
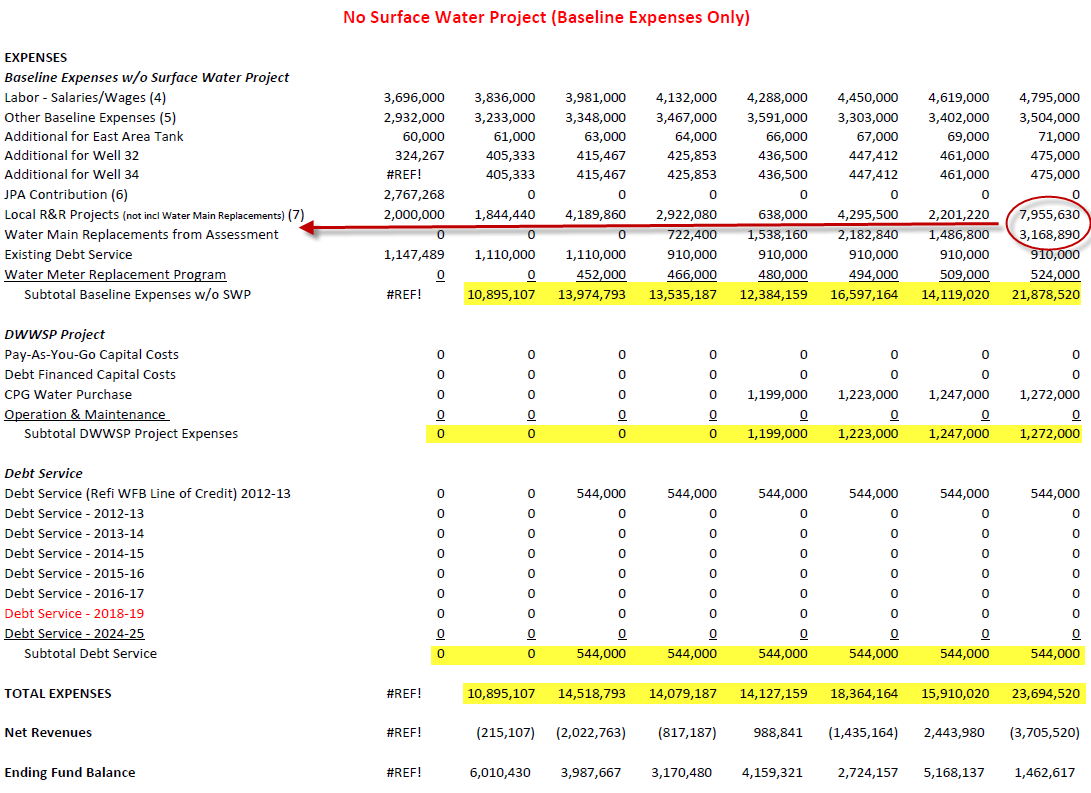
We also see the breakdown of costs for both the NSWP option (No Surface Water Project option) and the SWP option (Surface Water Project).
In the first chart we see that the largest expenditure difference in year six from the current year is in two categories. The increase in the local R&R projects that do not include water main replacements, and the water main replacements, account for the largest part of the cost increase.
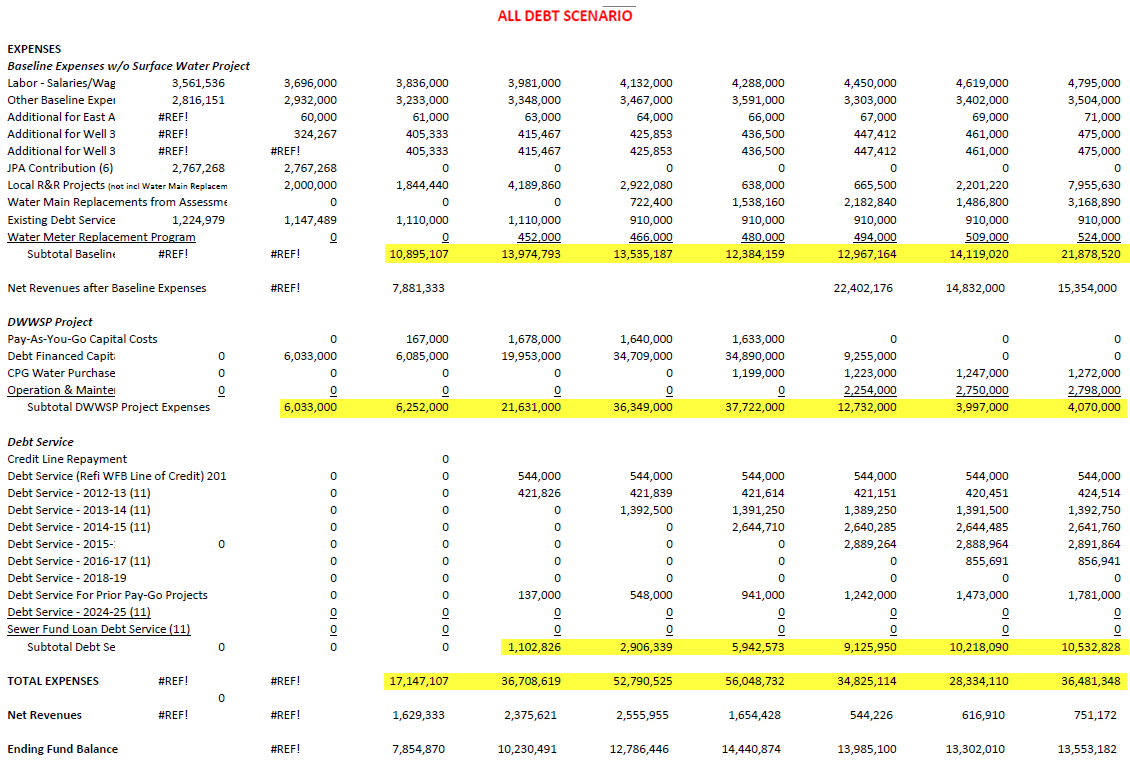
In the all-debt scenario, we see the exact same costs for the baseline expenses. The difference is that we start adding in costs for the Davis-Woodland Water Supply Plant and increasing debt service.
So we see the large-scale debt-financed expenditures kick in with $19.95 million, then $34.7 million and $34.8 million before those costs begin to tail off. What increases dramatically is the amount spent on debt servicing increase from $1.1 million up to $10.5 million.
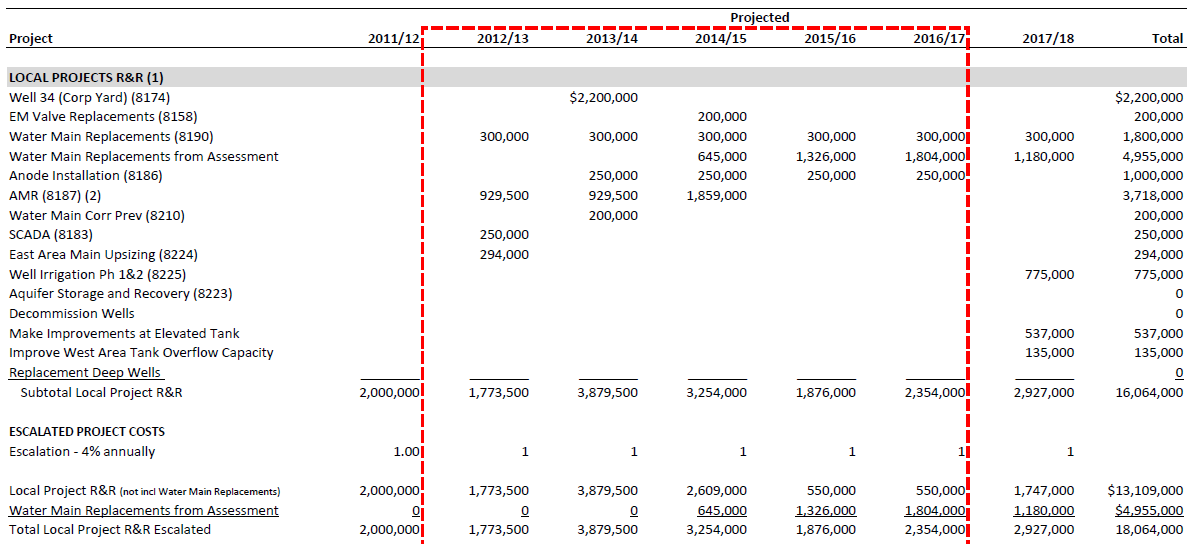
If you click on the chart above, it begins to show the itemization of the costs – what the local R&R projects as well as replacement for the deep wells will cost, and their increases over time.
Overall Summary
It is important to recognize that we only have comparative data six years out. Under the original scenario, the revenue would hit its peak around 2017 and then flat line for nearly a decade before needed upgrades would drive the revenue up to nearly $40 million.
Under the all-debt financed project, the revenue needs will continue to go up slowly but steadily for another nearly 20 years.
The City’s General Manager for Utilities, Herb Niederberger, argued against that option in the long term on January 15, telling the council, “We did not think this was the most prudent way to establish rates.”
“If you finance all of the projects through a conventional debt scenario, the first five years of rate increases is lower than what we have proposed, by about 15%,” he said. “If you look at the long term… you see that over time, we have to collect a lot more revenue from the customers in order to pay back the financing, the addition debt incurred by the local projects.”
Originally the city projected about a 50% increase in the costs without a project.
As Matt Williams noted yesterday, the difference is that the 50% did not include the “capital expenses associated with maintaining the existing system when they came up with the 50% estimate. That was a small $37 million omission (sarcasm noted).”
What are those costs? We laid out those costs in our Monday article.
As we noted last week, over the next 30 years, with a surface water project, we will see rate increases will produce $937 million in revenue, $461 more than the inflation-adjusted baseline revenue.
Matt Williams attempted to explain what was driving those figures, using the original model that had pay-as-you-go aspects in addition to debt financing.
“If one looks at the $28.2 million revenue requirement in 2018 in the ‘blue line’ rate scenario, the $12.9 million base costs for the existing system when a 4% CPI is applied to them rise to $15.7 million,” he explained.
“Add to that figure the 2018 annual Debt Service number of $7.6 million and you are at $23.3 million. Add in your $1.65 million for the CPG water purchase and you are at $25.0 million (rounded). Now add the annual SWTP M&O of $2.75 million and you are at a $27.75 million total,” he said. “Again, the revenue requirement that the rates use is $28.2 million. Where is the pork? That 0.45 million difference exists because your interest rate assumption is less conservative than the City’s. Until we have actual rates we are all making some assumptions.”
What we still do not know is how much the rates would continue to go up after 2018-19. However, in the short term, there is very little difference between the $24.8 million in revenue needed for the all-debt financed option of the surface water project in 2018 versus the $20 million needed without the project.
—David M. Greenwald reporting


Can someone explain to me why the pending regulatory fines (in 2016/2017?) are never included in the no-project scenario? How is that prudent? Is that not a “cost of doing business” should the community to voting no? Or am I only imagining that I’ve read and heard our community is confronted with regulatory fines?
And won’t the fines steadily increase until they are so painful that the community agrees to abide by the law of the land? I’ve not heard that regulators are in the habit of allowing violators to simply flaunt the law/regulations.
-Michael Bisch
-Michael Bisch
Where are the added costs to modify the waste water plant to accommodate the loss of the cleaner source water? We still have to come into compliance with the Clean Water Act, or as Michael B. points out, pay the fines.
There is no low cost option.
Michael; I think Matt is adding it to his model, but I’ve never gotten a clear indication as to what those costs are and how certain they will be.
[i]There is no low cost option.[/i]
That is a point that was made very early on in this debate. It is unfortunate that it has taken so long to get to a true bones of quantitative RIO analysis. Our public servants responsible for these things need some training on best practices for corporate decision suspport. You don’t start moving forward on a decision like this until you have a comprehensive set of data and have quanitified and qualified all cost and benefits so that they paint a clear justification for decision.
Because we don’t do this homework up front, we give all sorts of opportunity to the no-growth, no-change, status-quo people like my good neighbor Mike H. to create a wedge of opposition.
Analysis done right and done well, the data makes its own decision.
Michael and David, the challenge that incorporating fine costs into the model is that in the best case (most optimistic) scenario the fines each year will be small when compared to the overall annual water costs, while in the worst case (most onerous) scenario the fines each year will be hundreds of thousands of dollars, perhaps even millions of dollars. As a result of that, Joe Friday’s mantra of [i]”The facts ma’am, only the facts”[/i] causes me to see the fines as part of the narrative, but not part of a conservative fiscal model.
I realize that that means that the rate payers could be in line for a very painful “surprise” rate increase due to an onerous fine by the RWQCB like Linda County just incurred [url]http://sacramento.cbslocal.com/2013/01/14/linda-county-water-district-fined-more-than-100k-for-wastewater-violations/[/url]. The RWQCB’s decisions about when to escalate fines is discretionary, and used as a painful last alternative to get a district to comply. Knowing when the RWQCB will reach that “tipping point” is hard to know with precision, and therefore hard to quantify in dollars and cents.
Still can not find staff report that estimated indirect cost of hard water. But have found these 5 basic problems of hard water and web link to the Water Doctor average family annual cost of hard water.
5 Fatal Problems with Hard Water
1. Scale build-up inside your pipes. Hard water causes a build-up of scale from mineral deposits. Over time, pipes clog, water flow diminishes, and water pressure is reduced.
2. Scale build-up inside water heater. Water heater life dramatically drops. Heating elements burn out prematurely. A 1/8” of scale build-up at the base of a water heater causes 30% more energy needed to heat water, meaning longer recovery rates and cold showers!
3. Scale build-up on plumbing fixtures and shower doors. You will notice when hard water adheres to your shower doors or fixtures it leaves the scale behind. In most cases the scale build up causes permanent damage and is nearly impossible to completely remove. Note: Houses with scale prevention systems in place have a higher resale value and homeowners spend no time scraping scale from these surfaces.
4. Soap usage increases with hardness levels. Soaps do not lather or rinse well. There is a big difference in this area with soft water. Soft water uses less soap–whether it’s dish detergent, shampoo, or laundry soap. Soft water creates better washing power so you can use less soap and get superior results. Soft water allows a use of 1/2 to 2/3 LESS soap with the same or even better results. Plus, the soap rinses completely from your skin, clothes & household surfaces.
5. Water using household appliances are damaged with hard water. Life is reduced and performance decreased due to minereal deposits building up within. With soft water, appliances will last longer. Whether it’s your coffee pot, your humidifier, hot tub, or ice-maker, soft water inhibits a build-up of minerals and adds life to these products.
http://www.waterdoctorplus.com/media/AA/AD/waterdoctorplus/downloads/4717/AverageCost_Poster.pdf
The big advantage of the West Sac deal was that the finance costs and thus total water costs were much less. West Sac has huge excess capacity and capability for more. Also, they sit on the river so have rights we do not. We have learned that it was the City not West Sac that backed out – the City wanted to own it! But now they are considering shipping waste-water to Woodland where there is excess capacity!
As I recall Davis water rates doubled during the 2000-2010 decade. I protested during one stretch of 5 years when they were going up close to 20%/yr. The new proposed rates will put us at the top of rates and costs or in the top 1% depending what other cities do! The warm summers here push costs up unless one finds a way to go to dry and brown landscaping.
Stephen – Exactly!
Talk about hard water costs!
Stephen, years ago, we added a water softener at our 20-month-old home after our dishwasher failure ruined 150 square feet of wood flooring. Feel free to add that to your list, although homeowner insurance paid most of the bill. It turns out dishwashers are notoriously susceptible because of their basic design.
We recently replaced the salt softener with a potassium unit. Although someone earlier claimed no one would give up softeners or bottled water if we proceed, we’ll be glad to convert to better quality Davis water without clinging to our old ways.
Paul, your statement “The new proposed rates will put us at the top of rates and costs or in the top 1% depending what other cities do!” is not supported by the facts. If you read the 2011 California-Nevada Water Rate Survey published by the American Water Works Association [url]http://joekrovoza.org/wp-content/uploads/2012/10/CA-NV-2011-Water-Rate-Survey.pdf[/url], and specifically the chart on page 12, you will find that Yolo County’s average water bill is exactly the same $34.00 as our current “typical” SFR bill in Davis. That puts us at 15th lowest out of the 48 reported counties.
How will the new rate structure change that? If Measure I is passed and the Prop 218 rates are approved our 2013 bill for 15 ccf per month will rise to approximately $40.01, which would move us to 18th out of 48 if all the other counties don’t raise their rates. In 2014 the 15 ccf per month bill in Davis will rise to approximately $45.95, which will move us to 23rd out of 48, again if all the other counties don’t raise their rates. In 2015 we go to approximately $59.18 which means 35th out of 48 if all the other counties don’t raise their rates for a third year in a row. In 2016 we go to approximately $68.67 which means 40th out of 48 if all the other counties don’t raise their rates for a fourth year in a row. In 2017 we go to approximately $73.95 which means 45th out of 48 if all the other counties don’t raise their rates for a fifth year in a row. So even after five years in the very worst case scenario we are not in the top 1%.
As the report notes “in four regions for the 2009 and 2011 California surveys water rates on whole are trending higher.” What was that trend? The table on page 10 of the report shows the annual percentage increases for the two years between the 2009 survey and the 2011 survey. For Central Coast counties the increase was 31%. For Northern counties the increase was 14%. For Southern counties the increase was 18%. For San Joaquin Valley counties there was a decrease of 15% that AWWA says “is likely due to a significant number of utilizes in that region installing meters over the last couple of years.
As a point of comparison, the percentage increase in water rates when comparing the Davis 2014 rates to the Davis 2010 rates is an increase of 35%. Spread those four years out into two equal two-year increments and our rates are going up 17.5% which is quite consistent with the 14% that our fellow Northern counties experienced.