
A recent conversation about the fiscal impacts of the student housing project prompted a poster to basically assert that housing costs for the city eventually exceed property tax revenue.
The reality is that housing costs ALWAYS exceed property tax revenue, but property tax only represents about 35 to 40 percent of total revenue from a project.
The bigger picture is the ongoing myth that housing projects are eventually fiscal losers for the city – as I will show you, that is simply untrue and the reality is not only far more complex, but also has a number of moving parts.
To illustrate the issue I have pulled a recent project fiscal analysis for Sterling Apartments. Sterling, of course, is interesting because, in a way, it actually understates the fiscal benefit of housing projects. That is due to the fact that it has onsite affordable housing, which means that a portion of the property actually generates no property tax.
The reason is that the affordable housing dedication site is presumed to be run by a non-profit which would preclude the collection of property tax and so, for a portion of the property, it is accruing costs for city services without generating as much property tax as it could with offsite affordable housing.
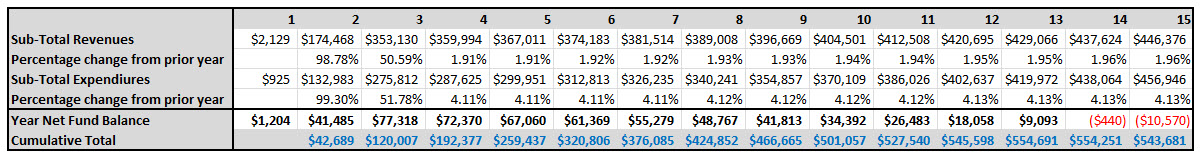
The above chart is derived from the city’s fiscal analysis.
As you can see this looks at the impact of the first 15 years. And we can see a number of interesting features.
First the assumption is that, by year three, build out is largely completed. After year three, revenues are projected to increase by 1.91 to 1.96 percent annually while expenditures increase at more
than twice the rate, from 4.11% to 4.13% annually.
Second, the project is annually in the black up until year 14 where it has a negative $440 fund balance and year 15 where it has a negative $10,570.
At this point, I’m going to make several arguments that say that this project is a net fiscal benefit to the city – period.
First of all, just taking this chart at face value and agreeing with the revenue and expenditure forecast assumptions, I will argue that the project basically pencils out. You have a project that in year 15 is a negative $10,000 in net revenue – that’s essentially fiscally neutral at that point in time.
Furthermore, at some point you have to argue that the reason the project seeps into the red by year 15 has nothing to do with the project itself and everything to do with the structure of city compensation. If the city figures out a better way to cost contain, even the tiny negative in year 15 is a positive.
But there is a more fundamental question here which is: at what point are we really going so far out that we are no longer measuring the impact of development itself? But I digress, because there are more critical points still to make.
Second, the fiscal analysis here is actually pretty conservative in that it assumes a 4.1 percent annual increase in the cost to provide city services. That is what those expenditures actually are. Nearly 60 percent of the costs are for police and fire – and the assumption here is not only that compensation is going up but that the project is actually measurably increasing demands for services.
As we know from the discussion around Nishi, the building of Nishi was not going to add a single fire person or police officer to the city – so there is a real question as to whether these are even real numbers. If they are theoretical numbers, then you are basically creating a hypothetical fiscal analysis rather than a real one that measures real costs which would be added to the general fund as the direct result of this project.
Third, along the same lines, I think we have to wonder exactly how realistic the 4.1 percent expenditure increase actually is. To analyze that, we can look to Bob Leland’s April presentation to the city council.
In his presentation he found that general inflation is increasing at about two percent per year, slightly lower than the more traditional three percent. His model will assume about a two percent annual COLA (cost-of-living adjustment) over time.
Mr. Leland projects that the growth rate in salaries from 2001 to 2036 would be about 2.76 percent per year. The current decline in salaries is not going to continue, he reasons. He believes that vacancies will be filled and labor agreements will take into account cost-of-living increases over time.
But that is still more modest that the 4.1 percent annual expenditure increase that the fiscal analysis assumes. So I re-worked the projects assuming a constant 2.7 percent cost increase rather than a 4.1 to 4.13 percent cost increase.
The result was that instead of $456,946 in expenditures in year 15, the projection was $379,715 and therefore, instead of a $10,000 negative balance, we have a positive $66,660 balance.
Which one is right? As one person told me, the only thing we know for sure about projections is that they will be wrong. However, this exercise I think is helpful, because it gives us a range now as to what we can expect.
One of the keys to making housing and other projects pencil out is cost containment. And the reality is – as we learned with the 2004 sales tax increase – even a pure revenue measure is only as good as your cost containment. The 2004 sales tax increase, for instance, generated a gross of $3 million, but by 2006 all of that revenue was offset by increases in salaries from the MOUs that the council agreed to. So the net fiscal benefit of the tax actually became a negative because the tax enabled the council to agree to massive salary and benefit increases.
The projections, therefore, show us that if we adhere to the Bob Leland’s projections – even in year 15 when the impact of a development is dubious at best – the project on paper is in the black.
Finally, looking at annual impacts might not be the best way to assess the impact of a project anyway. So, in the chart, I create another row called cumulative total. What it shows is that just looking at ongoing costs and revenues, the project by year 15 is still, in total, a positive half million for the city coffers.
But that only looks at one end of the equation. The staff report on Sterling notes, “The development will also generate a one-time fiscal benefit to the City of $3.2 -3.3 million in construction tax and development impact fees revenue.”
So, even if you believe that by year 15 the project is doing more harm than good to the community, the total benefit to the city from start to finish approaches $3.9 million even in year 15.
Here are some quick concluding thoughts here.
First, the revenues here do not suggest that the city should be looking to housing developments as a source of revenue. What they do suggest is that about 10 years or so ago, the city became much more careful in how it conducted its fiscal analysis on housing and in making sure that projects pencil out – and I think, based on my closer scrutiny of Sterling, that this project more than pencils out.
Second, cost containment is probably the most important thing that the city needs to do in the next few years, as it will not overcome the current functional deficit but will allow other measures to work to do just that.
Third, I would be careful when making blanket statements about development projects penciling out –they are much more complex than people think.
Fourth, I think we need to do a full analysis of the impact of the university building large-scale housing on campus and what the fiscal impact of that will be on the city.
Pretty much the only revenue the city might get from students living on the UC Davis campus is sales tax.
The sales tax generated from Sterling is only projected at about $133,000. If the university were to add 10 thousand students to campus they would probably add retail and restaurants to serve them, which would cut somewhat into the benefits the city would receive.
On the other hand, a lot of the cost projections for public safety will be felt regardless of whether the residents are technically in the city or not. It is something to at least analyze.
—David M. Greenwald reporting


An on-site liquor store and dope house would change the fiscal outlook considerably.
This has about as much truth in it as David’s denial (based upon his own beliefs) of air quality concerns at Nishi.
Well, the “city” (and just about every other city in California) has not done so, to date. Unlike revenues, expenditures for services are not controlled by Proposition 13.
I’ll say. Just about every other presentation that the Vanguard presents shows costs for services (e.g., salaries, retirement and medical benefits) rising at a much faster rate. Not sure if any of this includes rising costs for contract work (e.g., road repairs needed as a result of heavy Unitrans buses).
Sort of like your “assumptions” regarding air quality, at Nishi.
Right. There’s no way it can “increase demand” for these services. 🙂
Assuming that the first part of that statement is true, “time/hours” has a cost that must be appropriately allocated. Failure to do so means that others are subsidizing the cost. (The same is true for costs related to facilities.)
You’re the one who only looks at “one side of the equation”. Those one-time fees are to cover real impacts (such as share of facilities). As population increases, facilities (also) need to increase at some point. If a development does not pay its share, the burden will fall upon others. Not sure what else it covers – perhaps staff time (which wouldn’t be needed if the development had not occurred?) If any of this is incorrect, then what are those fees used for? (City “profit”?)
What a development-oriented rag the Vanguard has become. You ought to be ashamed of this. You have access to real information to make your arguments.
Huh? Or is that just a typo… ?
It was a typo that has been fixed, and now reads “That is due to the fact that it has onsite affordable housing, which means that a portion of the property actually generates no property tax.”
On top of that, there’s evidence that the city is likely UNDER-CHARGING impact fees for multi-bedroom units. There’s also the issue of parcel taxes, which are the same for entire apartment complexes as they are for single-family units.
Yes, it’s becoming more and more apparent that single family homeowners are going to be asked to take on a much larger share of the city’s financial burden than renters who represent a huge portion of the Davis population.
This property generates $173K in property tax, a parcel tax is like $250 a year. Just to put your point into perspective.
Really, David. It’s like you have some kind of connection to developers at this point.
How did you find out about the Nishi proposal?
Maybe you can actually address the numbers and arguments presented here rather than jump to assumptions.
I did create a cursory response, which took me all of 5 minutes. I don’t really have any “assumptions”, it’s an impression based upon your increasingly shrill and one-sided presentations.
But really, it isn’t worth constantly researching and fighting misinformation, day-after-day. Have at it. But, this does cause the Vanguard to lose whatever credibility might remain. Perhaps you don’t care about that. In any case, the Vanguard is not a good source for complete and objective information or analysis.
As a side note, (some) of John’s points below seem valid, as well.
As I side note, I spent a few hours working on this piece, maybe your response was inappropriate. Maybe no response would have been better if you don’t wish to have a substantive conversation.
David: This appeared to be directed at me:
I haven’t fully analyzed Matt’s response (below), but noticed that even he stated the following:
If you’re going to work on an article “for hours”, perhaps you should not base it upon a “foundation of sand”.
Again, your articles are increasingly one-sided, to the point of presenting misinformation. (Not just today’s article.)
Matt is trying to improve the city’s fiscal analysis which is much needed and I completely support.
My analysis here took the best available to data and also my analysis pointed out a number of problems with the numbers that were used as well, so I don’t see the two being at odds.
David: You made up your own assumptions, including discounting the Leland model (probably in the wrong direction, if anything).
The first step in understanding this would be to understand what the Leland model includes (and assumes). I’d like to see a complete breakdown, regarding where those numbers/percentages come from. (Yes, I know that I can research this myself. But, I’m not the one who is creating an article.)
No, Ron… you want others to do the work (you used a pretty lame excuse, as the article is commentary/opinion, not “reporting”), so when they write it up, you can ‘pot-shot’ it, or ask new questions that you demand are answered. Modus operandi.
Not meant as an insult, but my interpretation of patterns I think to see in your posts. If I’m wrong, my bad.
Howard: I (and others) have already pointed out some obvious flaws. And again, I’m wondering if the Leland model referencing the “4.1%” annual increase includes all costs (such as those referenced by Matt and Don, below). (And, discussed on a broader level by Richard.)
If one is going to present an “opinion” article, it’s more effective if all objective facts are presented and addressed. Presenting one side (and adding one’s own assumptions) undermines one’s own arguments. It’s not my job to continually point this out.
But, in a sense, you’re right. My interest only goes so far, and I’m not willing to devote full-time effort to point out shortcomings and discrepancies, day-after-day. Perhaps it’s fortunate that some are obvious without even digging further. And, despite the one-sided reporting, I do sometimes learn things from these articles and subsequent comments (and referenced documents).
And, at times, I’ve presented information which hasn’t been discussed much, on the Vanguard (e.g., the state-wide nature of the unfunded liabilities problem). (If one only reads the Vanguard, you might think that Davis is the only city facing this problem. And, you might believe that Davis will “uniquely solve” this problem on its own.)
Correction – “John”, not “Richard”.
“You made up your own assumptions, including discounting the Leland mode”
What? I made up my own assumptions? How so? I didn’t discount the Leland model, I used it. I don’t think you even know what you’re saying here because it’s the opposite of what I did.
One example, regarding the Leland model:
On a more important note, I’m still wondering if the Leland model includes the types of costs that Matt and Don are referring to (e.g., including expected increases in pensions and medical costs), for example. (With an appropriate portion allocated to Sterling, in your example.)
Yes, I re-worked the existing fiscal analysis using Leland’s projected cost increases.
It appears that you “reworked” Leland’s model to account for a reduction in the rate of salary increases (to a point which still eventually exceeds allowed property tax increases). Not sure if Leland’s model includes expected increases in pension and medical benefits in the first place. (From the article, it appears that it only deals with salary increases.)
No, I used Leland’s estimates and re-worked the Sterling model.
”Mr. Leland projects that the growth rate in salaries from 2001 to 2036 would be about 2.76 percent per year”
Well, if Leland’s model does not account for medical and pension costs (for employees who provide services to residences), then it shouldn’t be used as a reference to determine if a given development is paying its fair share of those costs. (A pretty serious problem, so I’m wondering if both of us are missing something here. Difficult to believe that the city would not consider this.)
Regardless of this thread/subject (or thoughts regarding the Vanguard’s reporting), I apologize for my earlier, overly-harsh tone and choice of words.
David,
If I may ask, what is the point of this article? Not even Sue Greenwald would have suggested that high-density, multi-family housing was other than fiscally neutral. So what is it that is going to fix the city’s unbalanced revenue model? It seems this article is merely tinkering around the edges if you are truly interested in discussing the fiscal issues – as you seem to profess.
The point that might have some bearing would be a discussion of the differences between student housing and high-density multifamily or workforce housing – and how those two might vary from one another with respect to potential revenues and expenses to the city.
The other important aspect of this conversation is the “either/or” nature of the land use decisions in an era of dwindling land resources. Does the 40 acre retail center, versus a 40 acre tech park, versus a 40 acre Internet Distribution hub, versus a 40 acre dormitory project, versus a 40 acre workforce housing project – result in the same or comparable revenue and expense streams for the city?
Those subjects are no even being discussed.
Your article truly serves to clarify the discussion about the fact that the City is running out of developable land.
We can either ignore that fact or we can encourage Mr. Leland and the Finance and Budget Commission to begin an honest conversation about the relative merits of these very different future scenarios and their implications for the future fiscal sustainability of our municipal services model AND what we are willing to own up to in terms our carbon dependent and highly commuter centric model which exists today.
It seems like it’s either that discussion, or a more full blown and realistic conversation about how much we should be raising our parcel and utility taxes on an annual basis.
Matt,
This sounds encouraging on an intra-city basis, but what of “How we’re doing?” in context of some other communities?
It seems few are aware that the City commissioned a comprehensive inter-city comparison covering a number of metrics at the urging of the Davis Planning Commission. This report has been available since April. What did we learn from this comprehensive comparison? Have the results been discussed in the Finance and Budget Commission?
At its September 11, 2017 meeting the FBC reviewed the new fiscal model the Community Development Department staff and Goodwin Consulting have put together to determine the net fiscal impact to the City of Davis (City) general fund of new development proposals. The 47-page Staff Report for that item can be accessed at http://documents.cityofdavis.org/Media/Default/Documents/PDF/CityCouncil/Finance-And-Budget-Commission/Agendas/20170911/Item-6-A-Fiscal-Development-Model.pdf
The model presented by Kelli Bruton from staff and Cindy Yan from Goodwin generated robust discussion by the FBC members, who formally submitted 30 questions/suggestions for inclusion in the model. Some of the most important of those suggestions (in my personal opinion) were:
— Key revenue and cost growth assumptions should be in sync with the ones made in the Leland model. All the assumptions should be in sync with the Leland model.
— Identify the sources of the key assumptions, for example, the assumed population per household for certain types of housing units
— Calculate a coefficient of uncertainty for the fiscal outcome (standard deviation is one option)
— Sales tax per capita – is there another way to average? It appears too high when thinking about the outside of Davis consumers that are driving a portion of the sales tax, yet their dollars are being calculated against Davis population.
— Include one-time construction tax and development impact fee amounts (include fees like sewer and hookup fees and items where credits offset payments) in the presentation of project fiscal outcomes, with clearly identified payment milestones
— Include one-time sales tax revenues from construction and include in one-time fiscal effects
— The model should include two “sections” that subtotal individually and roll up into a grand total. The first “section” would be recurring revenues and expenses year-by-year throughout the 25-year period. The second “section” would be one-time revenues and expenses year-by-year throughout the project buildout period. The grand total rollup would sum the first and second section values year by year.
— Add into the costs an estimate of replacement funding that would be collected over time to replace public infrastructure. Such estimates should be driven by the expected useful life of the public infrastructure components.
— Since the expected useful life of some of the components of public infrastructure is 25 years, the model’s time durations should be extended from 15 years to 25 years.
oooooo Include Community Services District revenues categories. For example Nishi had the following such categories
oooooo Parks & Open Space Responsibility Revenues
oooooo General Community Services District Revenues (at 1.6%)
— Make Whole Provision Revenues to offset loss of property taxes due to UCD or Non-Profit rental or purchase of individual lots
— Include Community Facilities District (CFD/Mello Roos) Revenues
— Include Non-Secured Property Tax Revenues
— Include Miscellaneous Development Agreement Revenues
— Align expense categories with Annual Budget
ooooo City Attorney
ooooo City Council
ooooo City Manager’s Office
ooooo Administrative Services
ooooo Community Development and Sustainability
ooooo Parks and Community Services
ooooo Police
ooooo Fire
ooooo Public Works
ooooo Capital Improvement Projects
ooooo Debt Service
ooooo RDA Successor Agency
— Portray the estimated costs of city services on both a cash and an accrual basis – for example indicating more specifically in the cash version when specific City costs reflected in the fair-share accrual basis have actually been prepaid by the City. For example, the accrual of a proportional share of Fire Station construction costs would be reflected in the fair-share accrual basis, but if that Fire Station has already been constructed by the City, those construction costs would not be included in the cash basis.
Bottom-line, the model David is using is missing so many elements (both good and bad) that it is effectively useless. Therefore the points he is making in this article have to be taken with a grain of sand, because building on the model is building on a foundation of sand.
Managing expenses and projecting them just got a lot harder.

Don is correct. The bad news is that the CalPERS rates are going up. The good news is that the City’s 2017-18 budget had already included that 14% increase in CalPERS rates in the table at the top of page 4-6 of the Forecast. For Davis that means an increase from $6.50 million per year to $7.67 million per year. The bad news is that there is no current funding source for that $1.67 million increase. So services provided to the citizens of Davis are going to have to be reduced to cover the increased CalPERS pension expense.
Matt,
In case you missed my out-of-position post above:
Your rendition of the Sept 11th meeting of the Finance & Budget Commission sounds very constructive in terms of learning more about and better understanding our intra-city operations and trends, but what of “How we’re doing?” in context of some other communities?
It seems few are aware that the City commissioned a comprehensive inter-city comparison covering a number of metrics at the urging of the Davis Planning Commission. This report has been available since April. What did we learn from this comprehensive comparison? Have the results been discussed in the Finance and Budget Commission?
John, The results have not been discussed in the FBC. That comparison report currently does not appear anywhere on the FBC’s Long Range Calendar. To the best of my knowledge no one from the City has shared the existence of such a report with any of the FBC members. As a result the FBC has no sense of what we learned from this comprehensive inter-city comparison.
Can you provide a link to any places on the City website where anything about the inter-city comparison is documented? What were the metrics studied? Who did the leg work in producing the comparison report?
Happy to oblige:
Google: City of Davis, CA
Enter Search Term on City website: “State of the City Report”
http://cityofdavis.org/about-davis/search?q=state%20of%20the%20city%20
Download the 186 page report in .pdf format. Fast forward to .pdf page number 171 for the beginning data titled: APPENDIX D: CORE AREA PEER CITIES COMPARISON
To my limited knowledge, this list of cities was compiled by the Davis Planning Commission in conjunction with the Department of Community Development and Sustainability and with assistance from BAE Urban Economics, Inc as consultant.
John, thank you for the link. It is interesting that the State of the City Report is not front and center on the City website. It is also interesting that City Staff has not proactively made a presentation of the Report and its findings to all the City Commissions. I will ask the staff liaison and the FBC Chair to agendize a presentation of the Report’s contents.
With that said, having read the inter-city information provided in Appendix D starting on page 159 of the document and ending on page 174, I really do not see anything that answers “How we’re doing?” in context of those other municipal jurisdictions. There is a lot of descriptive information about those communities, but nothing about how those community metrics translate into revenues for each of the respective municipal jurisdictions, or into costs for each of those respective municipal jurisdictions.
The FBC faced a very similar challenge when the EPS economic study for the Innovation Centers was presented to us. EPS showed a $3 billion plus annual impact to the community economy, but only $5 million of revenues to the municipal jurisdiction. That is a 0.17% conversion rate … $1,000.00 of economic benefit to the community economy produces $1.70 of revenue for the municipal jurisdiction. That kind of minuscule ratio makes it very hard to come up with a “How are we doing?” answer for the municipal jurisdiction.
Matt,
Thanks for offering to take the lead recommending to agendize the report for review by the FBC.
I too wonder why, with all of the work that accompanied the gathering of this data, that there was not more attempt to use this report to provide a “compare and contrast” in context focused on “How we are doing?”
Perhaps, most importantly, the report does serve to establish a thoughtful selection of comparison communities for further discussion and analysis – particular if we pivot the focus to “community level” metrics and characteristics rather than simply their Downtown areas.
Don’t take that wrong, the Downtowns of these various communities do serve to tell us a great deal about their roles and significance within their respective communities and their central roles within their regions, but it is the “community level” metrics, locational characteristics, demographics and employment statistics which are all critical to understanding the functioning and operating role of their respective Downtowns.
Here’s hoping that we can flesh out this additional detail in a timely fashion in order that it can help to better inform the upcoming efforts of the CAAC.
And, back to my original comment – hopefully by taking this larger look at how the City of Davis/Davis Municipal Enterprise might best/optimally fulfill its strategic value proposition within context of the larger region – we will be better equipped to assess the community’s relative needs, priorities and opportunities from a multifaceted perspective including long term land use, jobs/housing balance, support for the university and sustainable transportation solutions.